4

I update one my freebsd box to 9-stable (totally new installation) and install net-snmp for monitoring.

uname -r 
9.1-PRERELEASE

pkg_info net-snmp-5.7.1_7 
Information for net-snmp-5.7.1_7:

Comment:
An extendable SNMP implementation
....


cat /var/db/ports/net-snmp/options 
# This file is auto-generated by 'make config'.
# Options for net-snmp-5.7.1_7
_OPTIONS_READ=net-snmp-5.7.1_7
_FILE_COMPLETE_OPTIONS_LIST= IPV6 MFD_REWRITES PERL PERL_EMBEDDED PYTHON DUMMY TKMIB DMALLOC MYSQL AX_SOCKONLY UNPRIVILEGED
OPTIONS_FILE_UNSET+=IPV6
OPTIONS_FILE_UNSET+=MFD_REWRITES
OPTIONS_FILE_SET+=PERL
OPTIONS_FILE_SET+=PERL_EMBEDDED
OPTIONS_FILE_UNSET+=PYTHON
OPTIONS_FILE_SET+=DUMMY
OPTIONS_FILE_UNSET+=TKMIB
OPTIONS_FILE_SET+=DMALLOC
OPTIONS_FILE_UNSET+=MYSQL
OPTIONS_FILE_UNSET+=AX_SOCKONLY
OPTIONS_FILE_UNSET+=UNPRIVILEGED

I have about 500 vlan on this machine, and collect info about interface through snmpd to 2 different software, zabbix and cacti.

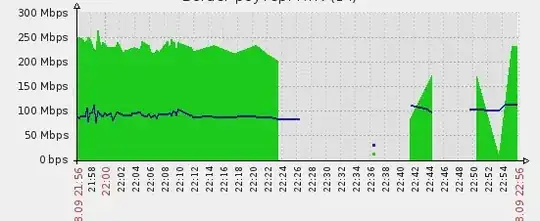
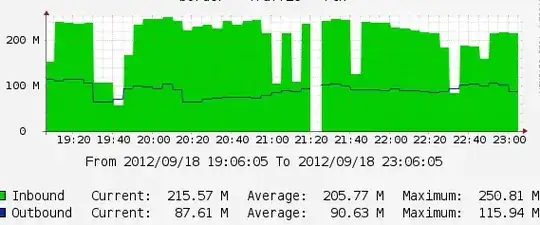
And both of them plot the graphs with blank fields.

zabbix cacti

I tryed change polling time in zabbix, from 15, sec to 30,60,90,120,10. And anyway i have blank fields.

snmpd.conf is empty - only a access controls.

This configuration worked fine on freebsd 8.

Where is my fault? How fix this graphs?

UPD: Changing pooling time, switch off one of agent, doesnt help. I look at zabbix log (recieved data from snmpd) and see that: sorry for russian locale, just look at numbers: zabbix data

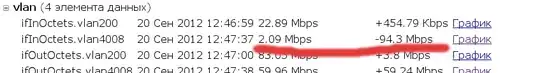
and thats is not true, as my "iftop" show speed was about 90Mbits, but snmpd return 2Mbits.

I understand that snmpd doesnt return speed, it return just a counter. But how its possible? why 2Mbit/s ?

I tryed recompile snmpd with 64-bit counters, and without it. In both variants this blank fields present.

So i think its my OS (freebsd) doesnt update interface counters well.

I still collect tcpdump for found this request/response. But have problem with that, to much trash.

UPD2: I decrypt tcpdump-ed file, and public this as google doc at gdocfile

Timediff looks strange.. Like zabbix sometimes "forget" do request, and then do twice at row, ehh

UPD3: I parse log from command "while true; do netstat -bin -I vlan4008 >> /var/log/netstat; sleep 300; done" and load as google docs, and add formula for speed : link

Looks like all counters in OS are good. Now i think problem in : 1. zabbix get request twice at row (and what about cacti) 2. snmpd use counter32

Korjavin Ivan
  • 2,230
  • 2
  • 25
  • 39

2 Answers2

5

This is usually related to the SNMP response not being received in a timely manner.
Because SNMP uses UDP that could mean network congestion or host congestion caused the request/reply to be lost, but more commonly one of the two machines involved simply couldn't get around to dealing with the request in a timely manner and the other machine got sick of waiting.

The chance of one machine or the other falling behind increases with workload -- If you have a lot of SNMP agents querying a particular host it may not service replies in as timely a manner as some of the agents expect (and those agents will show blank spots in the graphs, or report other errors).
Conversely if you have one agent querying a bunch of hosts - more than it can handle in your polling interval - the machines that don't get queried during the poll interval will have a gap in their graphs. (This problem was particularly common with Cacti's PHP poller, and lead to the development of cactid (now spine), which I strongly encourage you to use if you're not already using it).


My general advice on fixing this:

  1. Poll every 5 minutes, if possible.
    Most environments don't need 1/5/15/30/60/90/120 second polling intervals.
    If five-minute granularity is good enough for you, stick with it. It's less work for your servers, less work for your SNMP monitoring agents, and less data to store (or a longer period of time at "full granularity")

  2. Increase the SNMP timeout on your agents.
    Give the server more time to get around to your request. SNMP daemons are the lazy teenager of processes - you ask them to clean their room (or give you a tree's worth of data) on Monday, and on Wednesday or Thursday they might have picked up a few socks.

  3. Limit how much you're demanding from the server with each poll.
    If you just need one counter don't ask for the whole interfaces MIB -- it (usually) takes a longer time to walk the tree and generate full output than it does to just give you one OID.

  4. Limit how many agents are asking for data.
    If you can consolidate your monitoring to one box (Zabbix or Cacti) you'll be putting fewer demands on your server, and it's less likely to not respond in a timely manner.

If you're still having trouble after trying the above there is the ultimate debugging step: Hunt through your logs and Sniff the SNMP traffic. Make sure requests and responses are going back and forth in a timely manner and not being lost/rejected as malformed for some reason. Often looking at the data on the wire will give you a good indication of what's wrong and how to fix it.

voretaq7
  • 79,345
  • 17
  • 128
  • 213
  • Thank you alot. I read this, and now trying. Cacti always have 5 min interval, and did blank fields. But i understand about overloading, and switchoff zabbix at all. Points 1, 2, 3 are done already, now i try point 4 and collect tcpdump port 161. – Korjavin Ivan Sep 20 '12 at 04:58
  • Well, switch off zabbix, does nothing. Switch off cacti and set polling=5min in zabbix, does nothing too. Still blank fields. And i look at zabbix log, and see data from snmpd and yep, its snmpd return false values, so zabbix just graph this. I update post about this data. – Korjavin Ivan Sep 20 '12 at 07:01
  • I missed the part about `I have about 500 vlan on this machine` somehow -- so how long does it take your system to generate the SNMP tree when you walk it, and is the generated data correct? (See advice item #2 above: If it's taking too long to generate the reply your agents may just be ignoring the "late" data because it took too long to receive it) – voretaq7 Sep 20 '12 at 16:21
  • I never ask a tree. Always a snmpget one oid, like IF-MIB::ifHCInOctets.13. I try many times, and its work really fast. Also in tcpdump time between snmp get request and respond is ms. For example request at time:42.410097 answer at time: 42.410253. I think its REALLY fast. Also i try switchoff all vlan graphs except one, and this one have a blank fields. – Korjavin Ivan Sep 20 '12 at 16:39
2

Which version of SNMP protocol do you use? SNMP v1 does not supports 64bit counters. It's an old issue with Cacti, just switch to "Version 2" on relevant "Device"

MrBr
  • 121
  • 2