I'm getting some conflicting information regarding the memory use of a virtualized server. The most alarming information is this:
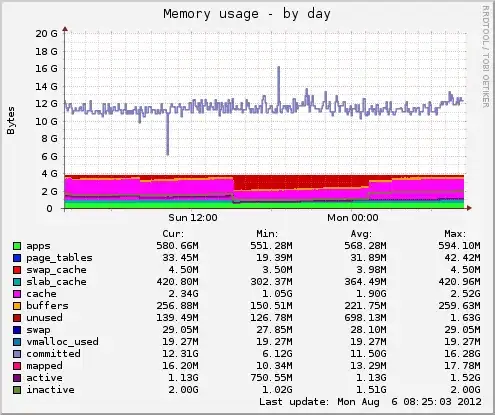
Note that the server has only 4GB of RAM allocated, even though committed shows 12GB.
Also, if i run ps aux | grep httpd I get the following:
root      1566  0.1  9.5 580392 375540 ?       Ss   Jun18  96:15 /usr/local/apache/bin/httpd -k start -DSSL
root      4212  0.0  9.4 580388 371948 ?       S    08:01   0:00 /usr/local/apache/bin/httpd -k start -DSSL
nobody    7674  0.6  9.5 580392 373600 ?       S    08:26   0:02 /usr/local/apache/bin/httpd -k start -DSSL
nobody   10894  0.6  9.5 580532 373508 ?       S    08:28   0:01 /usr/local/apache/bin/httpd -k start -DSSL
nobody   11668  0.6  9.5 580392 373600 ?       S    08:29   0:00 /usr/local/apache/bin/httpd -k start -DSSL
nobody   11669  0.6  9.5 580392 373512 ?       S    08:29   0:01 /usr/local/apache/bin/httpd -k start -DSSL
nobody   11975  0.6  9.5 580392 373492 ?       S    08:29   0:00 /usr/local/apache/bin/httpd -k start -DSSL
nobody   12108  0.7  9.5 580392 373492 ?       S    08:29   0:00 /usr/local/apache/bin/httpd -k start -DSSL
nobody   12993  0.6  9.5 580392 373492 ?       S    08:30   0:00 /usr/local/apache/bin/httpd -k start -DSSL
nobody   13080  0.6  9.5 580392 373492 ?       S    08:30   0:00 /usr/local/apache/bin/httpd -k start -DSSL
nobody   13211  0.6  9.5 580392 373492 ?       S    08:30   0:00 /usr/local/apache/bin/httpd -k start -DSSL
nobody   13496  0.6  9.5 580392 373520 ?       S    08:30   0:00 /usr/local/apache/bin/httpd -k start -DSSL
nobody   13497  0.6  9.5 580392 373492 ?       S    08:30   0:00 /usr/local/apache/bin/httpd -k start -DSSL
nobody   13829  0.6  9.5 580392 373492 ?       S    08:30   0:00 /usr/local/apache/bin/httpd -k start -DSSL
nobody   13858  0.6  9.5 580392 373492 ?       S    08:30   0:00 /usr/local/apache/bin/httpd -k start -DSSL
nobody   13963  0.6  9.5 580392 373484 ?       S    08:30   0:00 /usr/local/apache/bin/httpd -k start -DSSL
nobody   14070  0.7  9.5 580392 373492 ?       S    08:31   0:00 /usr/local/apache/bin/httpd -k start -DSSL
nobody   14290  0.6  9.5 580392 373492 ?       S    08:31   0:00 /usr/local/apache/bin/httpd -k start -DSSL
nobody   14404  0.6  9.5 580392 373484 ?       S    08:31   0:00 /usr/local/apache/bin/httpd -k start -DSSL
nobody   14745  0.6  9.5 580392 373492 ?       S    08:31   0:00 /usr/local/apache/bin/httpd -k start -DSSL
nobody   14850  0.6  9.5 580392 373484 ?       S    08:31   0:00 /usr/local/apache/bin/httpd -k start -DSSL
nobody   14957  0.5  9.5 580392 373484 ?       S    08:31   0:00 /usr/local/apache/bin/httpd -k start -DSSL
nobody   15061  0.6  9.5 580392 373492 ?       S    08:31   0:00 /usr/local/apache/bin/httpd -k start -DSSL
nobody   15174  0.8  9.5 580392 373492 ?       S    08:31   0:00 /usr/local/apache/bin/httpd -k start -DSSL
nobody   15228  0.6  9.5 580392 373484 ?       S    08:31   0:00 /usr/local/apache/bin/httpd -k start -DSSL
nobody   15263  0.4  9.5 580392 373484 ?       S    08:31   0:00 /usr/local/apache/bin/httpd -k start -DSSL
nobody   15264  0.5  9.5 580392 373484 ?       S    08:31   0:00 /usr/local/apache/bin/httpd -k start -DSSL
nobody   15290  0.7  9.5 580392 373484 ?       S    08:31   0:00 /usr/local/apache/bin/httpd -k start -DSSL
nobody   15291  0.5  9.5 580392 373484 ?       S    08:31   0:00 /usr/local/apache/bin/httpd -k start -DSSL
nobody   15294  0.4  9.5 580392 373484 ?       S    08:31   0:00 /usr/local/apache/bin/httpd -k start -DSSL
nobody   15296  0.6  9.5 580392 373492 ?       S    08:31   0:00 /usr/local/apache/bin/httpd -k start -DSSL
nobody   15401  0.5  9.5 580392 373484 ?       S    08:32   0:00 /usr/local/apache/bin/httpd -k start -DSSL
root     15506  0.0  0.0 103228   840 pts/0    S+   08:32   0:00 grep httpd
This totals up to over 294.5% of memory used.
top gives similar results too.
However, if I run free -m I get this:
             total       used       free     shared    buffers     cached
Mem:          3831       3647        184          0        257       2358
-/+ buffers/cache:       1031       2799
Swap:         4031         29       4002
This seems OK to me, no sign of overcommitted memory.
The server is relatively quick, there's no unusual downtime/sluggishness, and I'd like to keep it that way. Are the abnormal readings just an anomaly, or something more serious?