I am currently setting up a new Debian (6.0.5) server. I put Cacti (0.8.7g) on it yesterday and have been battling with it ever since.
Initial issue
The initial issue I was observing, was that my graphs weren't updating. So I checked my cacti.log and found this concerning message:
POLLER: Poller[0] Maximum runtime of 298 seconds exceeded. Exiting.
That can't be good, right? So I went checking and started poller.php myself (via sudo -u www-data php poller.php --force). It will pump out a lot of messages (which all look like what I would expect) and then hang for a minute. After that 1 minute, it will loop the following message:
Waiting on 1 of 1 pollers.
This goes on for 4 more minutes until the process is forcefully ended for running longer than 298s.
So far so good
I went on for a good hour trying to determine what poller might still be running, until I got to the conclusion that there simply is no running poller.
Debugging
I checked poller.php to see how that warning is issued and why. On line 368, Cacti will retrieve the number of finished processes from the database and use that value to calculate how many processes are still running. So, let's see that value!
I added the following debug code into poller.php:
$finished_processes = db_fetch_cell("SELECT count(*) FROM cacti.poller_time WHERE poller_id=0 AND end_time>'0000-00-00 00:00:00'");
print "Finished: " . $finished_processes . " - Started: " . $started_processes . "\n";
Result
This will print the following within a second of starting poller.php:
Finished: 0 - Started: 1
Waiting on 1 of 1 pollers.
Finished: 1 - Started: 1
So the values are being read and are valid. Until we get to the part where it keeps looping:
Finished:  - Started: 1
Waiting on 1 of 1 pollers.
Suddenly, the value is gone. Why? Putting var_dump() in there confirms the issue:
NULL
Finished:  - Started: 1
Waiting on 1 of 1 pollers.
The return value is NULL. How can that be when querying SELECT COUNT()...? (SELECT COUNT() should always return one result row, shouldn't it?)
More debugging
So I went into lib\database.php and had a look at that db_fetch_cell(). A bit of testing confirmed, that the result set is actually empty.
So I added my own database query code in there to see what that would do:
$finished_processes = db_fetch_cell("SELECT count(*) FROM poller_time WHERE poller_id=0 AND end_time>'0000-00-00 00:00:00'");
print "Finished: " . $finished_processes . " - Started: " . $started_processes . "\n";

$mysqli = new mysqli("localhost","cacti","cacti","cacti");
$result = $mysqli->query("SELECT COUNT(*) FROM poller_time WHERE poller_id=0 AND end_time>'0000-00-00 00:00:00';");
$row = $result->fetch_assoc();
var_dump( $row );
This will output
Finished:  - Started: 1
array(1) {
  ["COUNT(*)"]=>
  string(1) "2"
}
Waiting on 1 of 1 pollers.
So, the data is there and can be accessed without any problems, just not with the method Cacti is using?
Double-check that!
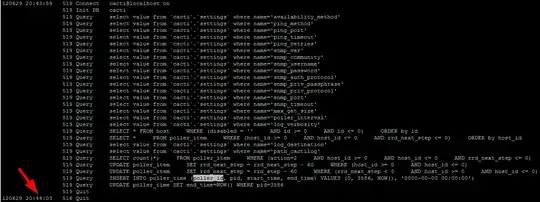
I enabled MySQL logging to make sure I'm not imagining things. Sure enough, when the error message is looped, the cacti.log reads as if it was querying like mad:
06/29/2012 08:44:00 PM - CMDPHP: Poller[0] DEVEL: SQL Cell: "SELECT count(*) FROM cacti.poller_time WHERE poller_id=0 AND end_time>'0000-00-00 00:00:00'"
06/29/2012 08:44:01 PM - CMDPHP: Poller[0] DEVEL: SQL Cell: "SELECT count(*) FROM cacti.poller_time WHERE poller_id=0 AND end_time>'0000-00-00 00:00:00'"
06/29/2012 08:44:02 PM - CMDPHP: Poller[0] DEVEL: SQL Cell: "SELECT count(*) FROM cacti.poller_time WHERE poller_id=0 AND end_time>'0000-00-00 00:00:00'"
But none of these queries are logged by MySQL. Yet, when I add my own database query code, it shows up just fine.
What the heck is going on here?
Digging deeper...
I concluded that the database connection must be lost somewhere in the process and adodb simply doesn't care.
So after a bit of digging around, I finally placed the debug message in drivers/adodb-mysql.inc.php, line 529, in the _close function. I wanted to see when the connection is closed.
I actually (finally) turned on PHP debugging and realized mysql_query() was called with a boolean connection id (an indicator of an intentionally closed connection).
// returns true or false
function _close()
{
    @mysql_close($this->_connectionID);
    echo "!!!! CLOSED !!!!\n";
    debug_print_backtrace();
    $this->_connectionID = false;
}
What does that print?
oliver@j27773:/etc/php5/conf.d$ sudo -u www-data php /usr/share/cacti/site/poller.php --force
06/30/2012 01:33:49 AM - POLLER: Poller[0] NOTE: Poller Int: '60', Cron Int: '300', Time Since Last: '61', Max Runtime '298', Poller Runs: '5'
06/30/2012 01:33:49 AM - POLLER: Poller[0] DEBUG: About to Spawn a Remote Process [CMD: /usr/bin/php, ARGS: -q "/usr/share/cacti/site/cmd.php" 0 3]
Finished: 0 - Started: 1
Waiting on 1 of 1 pollers.
Finished: 1 - Started: 1
06/30/2012 01:33:50 AM - POLLER: Poller[0] CACTI2RRD: /usr/bin/rrdtool update /var/lib/cacti/rra/j27773_servers_jiffybox_net_apache_sb_keepalive_100.rrd --template apache_sb_keepalive 1341012829:0
06/30/2012 01:33:50 AM - POLLER: Poller[0] CACTI2RRD: /usr/bin/rrdtool update /var/lib/cacti/rra/j27773_servers_jiffybox_net_apache_reqpersec_95.rrd --template apache_reqpersec 1341012829:.0228409
06/30/2012 01:33:50 AM - POLLER: Poller[0] CACTI2RRD: /usr/bin/rrdtool update /var/lib/cacti/rra/j27773_servers_jiffybox_net_apache_bytesperreq_90.rrd --template apache_bytesperreq 1341012829:13925.7
06/30/2012 01:33:50 AM - POLLER: Poller[0] CACTI2RRD: /usr/bin/rrdtool update /var/lib/cacti/rra/j27773_servers_jiffybox_net_cpu_85.rrd --template cpu 1341012829:1
OK u:0.00 s:0.00 r:1.00
06/30/2012 01:33:50 AM - POLLER: Poller[0] CACTI2RRD: /usr/bin/rrdtool update /var/lib/cacti/rra/j27773_servers_jiffybox_net_hdd_used_80.rrd --template hdd_used:hdd_total 1341012829:924741632:2677886976
OK u:0.00 s:0.00 r:1.00
OK u:0.00 s:0.01 r:1.00
OK u:0.00 s:0.01 r:1.00
06/30/2012 01:33:50 AM - POLLER: Poller[0] CACTI2RRD: /usr/bin/rrdtool update /var/lib/cacti/rra/j27773_servers_jiffybox_net_apache_sb_wait_105.rrd --template apache_sb_wait 1341012829:9
OK u:0.00 s:0.01 r:1.00
OK u:0.00 s:0.01 r:1.00
06/30/2012 01:33:50 AM - SYSTEM STATS: Time:1.1261 Method:cmd.php Processes:1 Threads:N/A Hosts:2 HostsPerProcess:2 DataSources:7 RRDsProcessed:6
Loop  Time is: 1.1291718482971
Sleep Time is: 58.867464065552
Total Time is: 1.1325359344482
!!!! CLOSED !!!!
#0  ADODB_mysql->_close() called at [/usr/share/php/adodb/adodb.inc.php:2141]
#1  ADOConnection->Close() called at [/usr/share/cacti/site/lib/database.php:68]
#2  db_close() called at [/usr/share/cacti/site/poller.php:455]
^C06/30/2012 01:33:55 AM - CMDPHP: Poller[0] WARNING: Cacti Master Poller process terminated by user
And now I'm too tired to investigate that...


