0

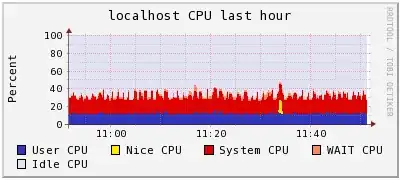
I'm coming from munin and a CPU graph contains data for system, user, nice, etc ALL on one graph. I just installed ganglia and setup the basic monitoring. It appears that each type of cpu data is a separate graph! WTF is this and can I change the defaults to combine these into a single per host?

That is my question, how do I combine cpu data into a single graph. Also, can I change the layout to something closer to munin's day-week side-by-side layout?

I'm trying to be impartial and give ganglia a chance. ;)

CarpeNoctem
  • 2,397
  • 4
  • 23
  • 32

2 Answers2

0

Ganglia is designed for monitoring clusters of many, many machines. It's rather over specified for only a few servers that aren't clustered. I don't know if you can change the default graphs, but you may be better off sticking with a solution designed for regular servers rather than tailored to high performance clusters.

However, if you want to customise Ganglia's graphs, I think you'll need 3.1 and the following web page,

http://sourceforge.net/apps/trac/ganglia/wiki/Custom_graphs

From that page,

New in the 3.1.x branch of Ganglia is an improved ability for users to create their own custom graphs, similar to the existing load, CPU, memory, network and packet reports. In the 3.0.x branch, all graphs were contained in a monolithic graph.php file, which made adding additional features somewhat difficult. Going forward, all graphs are generated separately, with one PHP file per graph type; including the basic metric graphs.

EightBitTony
  • 9,211
  • 1
  • 32
  • 46
0

Take a look at the summary graphs on the right side:

enter image description here

quanta
  • 50,327
  • 19
  • 152
  • 213