18

Updated, see bottom of the longish (sorry) question.

Looking at our memcached stats I think I have found an issue I was not aware of before. It seems that we have a strangely high amount of wasted space. I checked with phpmemcacheadmin for a change, and found this image staring at me:
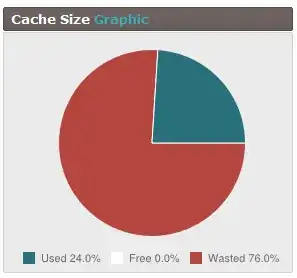
memcached cache size graphic

Now I was under the impression that the worst-case scenario would be that there is 50% waste, although I am the first to admit not knowing all the details. I have read - amongst others- this page which is indeed somewhat old, but so is our version of memcached. I think I do understand how the system works (e.g.) I believe, but I have a hard time understanding how we could get to 76% wasted space.

The eviction rate that phpmemcacheadmin shows is 2 ev/s, so there is some problem here.

  • The primary question is: what can I do to fix this. I could throw more memory at it (there is some extra available I think), maybe I should fiddle with the slab config (is that even possible with this version?), maybe there are other options? Upgrading the memcached version is not a quickly available option.

  • The secondairy question, out of curiosity, is of course if the rate of 75% (and rising) wasted space is expected, and if so, why.

System: This is currently not something I can do anything about, I know the memcached version isn't the newest, but these are the cards I've been dealt.

  • Memcached 1.4.5
  • Apache 2.2.17
  • PHP 5.3.5

As a response to @DavidSchwartz 's answer: here are the slab statistics that phpmemcacheadmin produces: (there are more slabs btw then these)

(I have also pasted stats from a bit later in text format here)
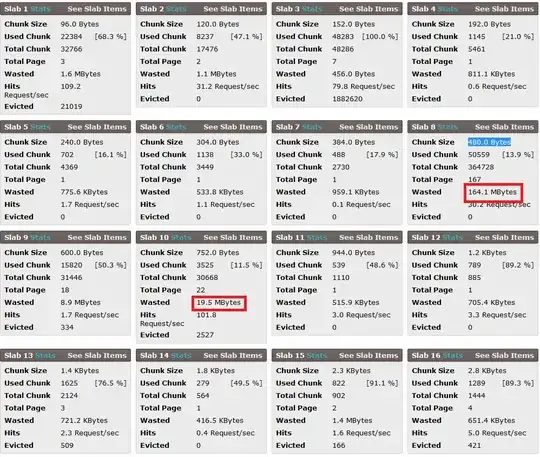
Slab details

UPDATE

I've restarted the daemon with -f 1.5, and it looked really good. After some warming we had a used / wasted of 50 / 50 . But, the same as before, the longer we had in the day (it gets busier during the day) it started falling back to what it currently is: 30 / 70, and wasted is still rising. Apart from that, I still don't know where the 'wasted' is coming from. I see this slab:

**Slab 5 Stats**
Chunk Size  496.0 Bytes
Used Chunk  77502 [24.6 %]
Total Chunk 314986
Total Page  149
Wasted      117.3 MBytes
Hits        30.9 Request/sec
Evicted     0

It isn't full, it has no evicted, but it is wasting 117.3 MBytes. The quick calculation I did (correct me if I'm wrong) was:

  • the previous slab has a chunk size of 328, so worst case this slab is filled with 329 byte chunks.
  • this means that it is wasting 167 bytes per used chunk = 12942834 bytes = 12.3 MB

So then where did the other 105 MB wasted come from? It's bigger brother right next to it looks like this:

**Slab 6 Stats** 
Chunk Size  744.0 Bytes
Used Chunk  17488 [31.0 %]
Total Chunk 56360
Total Page  40
Wasted      31.1 MBytes
Hits        107.7 Request/sec
Evicted     1109
Nanne
  • 602
  • 2
  • 8
  • 26
  • The problem is that there's tons of unused space in the other slabs, yet slab 3 is 100% full and seeing evictions. – David Schwartz Jun 11 '12 at 11:52
  • Good point, that would explain the evictions, though I'm not really sure how the 'wasted' number is calculated. If slab 8 only has 13.9% used, there surely must be some "free" space left there? – Nanne Jun 11 '12 at 12:03
  • Yes, there's free space in that slab. But that doesn't help if the objects that are being evicted don't go in that slab. – David Schwartz Jun 11 '12 at 12:13
  • That's what I figured from your answer, but why is there no free space listed? There should be some part of that pie-chart white (as it is on my test install) if there is still space left, at least, that's what I figured – Nanne Jun 11 '12 at 12:16

3 Answers3

10

It has been a year since this question and I don't know if you found your answer but I'm going to say your perception of "wasted" is wrong.

Wasted memory is allocated in memory so it can not be used by another application, but it still is available for memcached.

To simplify the explanation, assume you have a memcache with 3MB of ram with 3 Slabs:

slab class  1: chunk size     10485 perslab      100
slab class  2: chunk size    104857 perslab       10
slab class  3: chunk size   1048576 perslab        1

Execute a single "set" with a 10k size. You'll see in your statistics(roughly) that you have:

0.03% used
66.6% free
33% wasted

This is because memcached allocated a single chunk from "slab class 1" and 99% of the memory for that slab is "wasted" and 1% is "used" This does not mean that slab and the memory allocated for that slab is gone.

Execute another single "set" with 10k size. This time you'll see:

0.06% used
66.6% free
32.7% wasted

so now you are using 2 out of 100 allocated chunks in slab 1, "wasted" statistics dropped, and used statistics increased.

There is nothing wrong for used% + wasted% being equal to 100%. That does not mean you have no more memory left, it simply means you allocated at least one chunk from each and every slab.

To see this issue a "set" with 100k size and another one with 1000k size

Now you'll see

36.6% used
   0% free
63.3% wasted
kali
  • 216
  • 2
  • 3
  • That sounds good! Do you have any link to back this up? If so that means my memcache-server was (is) performing better then we think :). If I understand you correctly is that the wasted means it has been allocated, but is still available for use. This means that if nothing is free you cannot allocate more slabs though, but shouldn't mean you have problem per se? – Nanne Jul 05 '13 at 13:54
  • 1
    I do not have a link on top of my head but it is very easy to test yourself. Hit your command line and create a sample small server to test how it works. You can use -vv option for verbose debug messages, which will show you initial created slabs i.e: "memcached -vv -p 11500 -m 3 -n 10000 -f 10" will create you 3 slabs with chunk sizes 10k 100k and 1000k. And keep issuing "sets" and see your wasted/used statistics change exactly like I described above. – kali Jul 05 '13 at 14:27
  • good point. now to find out how I can get some extra attention to this answer for you :) – Nanne Jul 05 '13 at 14:38
6

You probably have a very large number of very small objects. Typically, the smallest slab holds 104-byte entries. If you have a lot of entries that just map one integer to another, you can get waste as high as 85%.

You can find information on how to tune around this in the article Memcached for small objects.

David Schwartz
  • 31,215
  • 2
  • 53
  • 82
  • If I read the stats page correctly this is not the case. Most waste is in a slab with 480.0 Byte-chunks. Let me check If I can show some stats... – Nanne Jun 11 '12 at 11:00
  • Oh, then this is fine and normal, nothing to worry about. There's just less data in there now. (Notice, for example, that that slab is only 14% used.) – David Schwartz Jun 11 '12 at 11:39
  • But how is 75% wasted normal? Does this number include unused space? I'd expect that to be counted as "free". Also, we see an increase in wasted // a decrease in used memory as the day goes by, while the site gets busier. That, and the fact that we do have evictions, make me wonder what can be done. – Nanne Jun 11 '12 at 11:46
  • Having fewer slabs may help avoid the problem of too much memory getting stuck in the wrong slab. For example, `-f 1.5 -I 2800` may help. – David Schwartz Jun 11 '12 at 11:59
  • The man-page is isn't too clear: the `-I 2800`, that means 2800K, as opposed to the 1M default? – Nanne Jun 11 '12 at 12:05
  • Oh, sorry. I didn't read your note that there are more slabs than that! If you're not changing the `-I` value now, don't change it. Just change the `-f` value to reduce the number of slabs. (I wonder why memcached doesn't have a slab defragmenter. That would solve this problem.) – David Schwartz Jun 11 '12 at 12:14
  • +1 especially for the comments :) – Nanne Jun 11 '12 at 12:19
  • Because of deployment-reasons I haven't tested this on our production server. Tests do say this is an option, but I can't say for sure until I get the real data in of course. Nevertheless I will mark this as accepted and will come back if there is a problem in the end :) – Nanne Jun 15 '12 at 11:53
  • I'm sad to say that it doesn't seem to be working :( – Nanne Jun 19 '12 at 11:55
  • No reduction in wasted memory? :( – David Schwartz Jun 19 '12 at 12:01
  • Nope, it looked really good in the first view minutes, but then "wasted" away :).. I've put some updated stats in the bottom of the Q. – Nanne Jun 19 '12 at 12:03
  • That's fine. The slab isn't full and has no evictions. It's just fragmented. – David Schwartz Jun 19 '12 at 12:05
  • I'm probably missing what the 'wasted' does actually mean, but in the end I believe its not something that should be high should it? The server _is_ seeing evections (though not in this slab), so I suspect there is sometime/place that there isn't enough space for all to go around. That's why it seemed to me that I might want to minimize that wasted number? I can't get the numbers to add up as to how such a number is compiled? I'll add the info for a slab next to it that does have evictions – Nanne Jun 19 '12 at 12:24
  • Everything seems fine now. You have no evictions from full slabs anymore as far as I can tell. – David Schwartz Jun 19 '12 at 13:40
  • but I do have evictions, and the amoutn of wasted space (zo not 'free') still is weird as far as I'm concerned. I just can't seem to figure out where this comes from. I understand If you're not really up to a elongated discussion in the comments btw, but chat is a bit tricky for me right now :) – Nanne Jun 19 '12 at 14:03
  • let us [continue this discussion in chat](http://chat.stackexchange.com/rooms/3820/discussion-between-david-schwartz-and-nanne) – David Schwartz Jun 19 '12 at 20:03
-1

I had this issue and moved from memcached to redis (without disk based saving). I know this might not be possible but you could try it as an option and keep an eye on the memory fragmentation. You could even turn persistence on to fix "old cache" issues on restart.