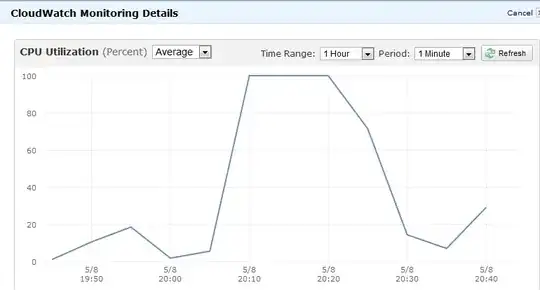
There are a couple of possible ways you can do this.
Note that its entirely possible its many processes in a runaway scenario causing this, not just one.
The first way is to setup pidstat to run in the background and produce data.
pidstat -u 600 >/var/log/pidstats.log & disown $!
This will give you a quite detailed outlook of the running of the system at ten minute intervals. I would suggest this be your first port of call since it produces the most valuable/reliable data to work with.
There is a problem with this, primarily if the box goes into a runaway cpu loop and produces huge load -- your not guaranteed that your actual process will execute in a timely manner during load (if at all) so you could actually miss the output!
The second way to look for this is to enable process accounting. Possibly more of a long term option.
accton on
This will enable process accounting (if not already added). If it was not running before this will need time to run.
Having been ran, for say 24 hours - you can then run such a command (which will produce output like this)
# sa --percentages --separate-times
     108  100.00%       7.84re  100.00%       0.00u  100.00%       0.00s  100.00%         0avio     19803k
       2    1.85%       0.00re    0.05%       0.00u   75.00%       0.00s    0.00%         0avio     29328k   troff
       2    1.85%       0.37re    4.73%       0.00u   25.00%       0.00s   44.44%         0avio     29632k   man
       7    6.48%       0.00re    0.01%       0.00u    0.00%       0.00s   44.44%         0avio     28400k   ps
       4    3.70%       0.00re    0.02%       0.00u    0.00%       0.00s   11.11%         0avio      9753k   ***other*
      26   24.07%       0.08re    1.01%       0.00u    0.00%       0.00s    0.00%         0avio      1130k   sa
      14   12.96%       0.00re    0.01%       0.00u    0.00%       0.00s    0.00%         0avio     28544k   ksmtuned*
      14   12.96%       0.00re    0.01%       0.00u    0.00%       0.00s    0.00%         0avio     28096k   awk
      14   12.96%       0.00re    0.01%       0.00u    0.00%       0.00s    0.00%         0avio     29623k   man*
       7    6.48%       7.00re   89.26%       0.00u    0.00%       0.00s
The columns are ordered as such:
- Number of calls
- Percentage of calls
- Amount of real time spent on all the processes of this type.
- Percentage.
- User CPU time
- Percentage
- System CPU time.
- Average IO calls.
- Percentage
- Command name
What you'll be looking for is the process types that generate the most User/System CPU time.
This breaks down the data as the total amount of CPU time (the top row) and then how that CPU time has been split up. Process accounting only accounts properly when its on when processes spawn, so its probably best to restart the system after enabling it to ensure all services are being accounted for.
This, by no means actually gives you a definite idea what process it might be that is the cause of this problem, but might give you good feel. As it could be a 24 hour snapshot theres a possibility of skewed results so bear that in mind. It also should always log since its a kernel feature and unlike pidstat will always produce output even during heavy load.
The last option available also uses process accounting so you can turn it on as above, but then use the program "lastcomm" to produce some statistics of processes executed around the time of the problem along with cpu statistics for each process.
lastcomm | grep "May  8 22:[01234]"
kworker/1:0       F    root     __         0.00 secs Tue May  8 22:20
sleep                  root     __         0.00 secs Tue May  8 22:49
sa                     root     pts/0      0.00 secs Tue May  8 22:49
sa                     root     pts/0      0.00 secs Tue May  8 22:49
sa                   X root     pts/0      0.00 secs Tue May  8 22:49
ksmtuned          F    root     __         0.00 secs Tue May  8 22:49
awk                    root     __         0.00 secs Tue May  8 22:49
This might give you some hints too as to what might be causing the problem.
