28

Following a discussion made HERE about how PHP-FPM consuming memory, I just found a problem in reading the memory in top command. Here is a screenshot of my top just after restarting PHP-FPM. Everything is normal: about 20 PHP-FPM processes, each consuming 5.5MB memory (0.3% of total).

enter image description here

Here is the aged server right before restart of PHP-FPM (one day after the previous restart). Here, we still have about 25 PHP-FPM with double memory usage (10MB indicating 0.5% of total). Thus, the total memory used should be 600-700 MB. Then, why 1.6GB memory has been used?

enter image description here

Googlebot
  • 1,007
  • 2
  • 15
  • 29
  • 4
    [Don't Panic! Your ram is fine!](http://www.linuxatemyram.com/) – ephemient Apr 08 '12 at 05:41
  • @ephemient no it's not the case here. I've checked all these stuff. This is something connected with PHP-FPM, and the memory will be freed by restarting PHP-FPM only. Anyway, the values of Mem and buffer/cache in `free` are identical. – Googlebot Apr 08 '12 at 06:40
  • 6
    Looks like you're running a Virtuozzo "VM". All bets are off as far as memory accounting goes on those things. – womble Apr 08 '12 at 07:51
  • http://stackoverflow.com/questions/131303/linux-how-to-measure-actual-memory-usage-of-an-application-or-process – Stone Apr 09 '12 at 10:07
  • 1
    Dear womble and ephemient: I stole both your answers! *cackles* – Wesley Apr 14 '12 at 06:08

2 Answers2

36

TL;DR 1

Your server is within some kind of virtuozzo/openvz/virtualization-du-jour container. Trying to make sense of memory usage is tilting at windmills.

TL;DR 2

Linux ate your RAM! But that's okay, it does it to everyone.


The Long Story

Let's break it down!

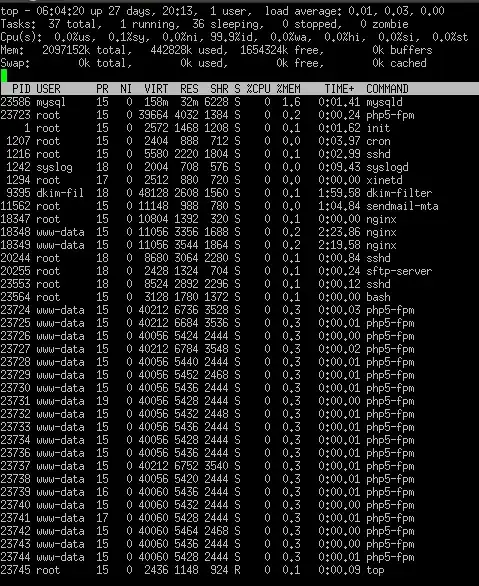
In the Mem: section we have:

  • $n total: the amount of physical RAM in your machine
  • $n used: how much memory is being consumed by Linux, not just the sum of the processes.
  • $n free: How much RAM is not being consumed by Linux. This does not take into account that cached and buffered memory is in essence "free".
  • $n buffers: buffer space is where blocks of disk I/O having been read or pending a write are stored. A buffer is a RAM representation of a single disk block.

In the Swap: section we have:

  • $n total: Self explanatory. Amount of disk space available to swap pages to.
  • $n used: Self explanatory. How much disk swap space is used.
  • $n free: Herp Derp.
  • $n cache: Closely related to buffers above. It's actually part of the page cache and itself has no space on physical disk. Don't worry about the details for this conversation.

The interesting part comes when you run free -m. You'll see three lines, and all of the numbers will correlate with top. I'll give my own PC as an example:

             total       used       free     shared    buffers     cached
Mem:          8070       7747        323          0        253       5713
-/+ buffers/cache:       1780       6290
Swap:         5055          0       5055

The Mem row shows total RAM in megabytes ($n total in top), how much is used ($n usedin top), how much is free ($n free in top), how much is shared (ignore that), and now comes the good part! The buffers and cached columns in free -m correlate to, predictably, $n buffers and $n cache. But take a look at the second row that of free -m that starts with -/+ buffers/cache:. The math shows that the used amount is really (total)-((used-buffers)-cached). Free is (total)-(theNewUsed).

What does all this mean? It means that Linux ate your RAM! The short story is that the Linux kernel gobbles up RAM as it is available to use for disk caching. There's nothing you can do about it unless you feel like trying to compile a custom kernel. Pro Tip: Don't.

The RAM is really there and free for processes to use at their whim. That's what's meant by the -/+ buffers/cache: row in free -m. However, you're inside non hyper-visor virtualization container which makes things a bit squirrely. You simply can't take stock of your memory with byte accuracy at this point. However, you're not seeing any behavior that's terribly unusual.

Keep Calm and Carry On. Also, get a physical server (unless you like memory statistics that look like Kreskin is your SysAdmin).

Wesley
  • 32,320
  • 9
  • 80
  • 116
3

Top isn't the best way to check memory usage. However, since my question was marked as a duplicate of this question, I'm going to post my resolution here.

I read on a forum that ps_mem.py will check the memory usage for you.

Repository: https://github.com/pixelb/ps_mem/

Download:

pip install ps_mem

Usage:

ps_mem

Output:

# ps_mem
 Private  +   Shared  =  RAM used   Program

  4.0 KiB +  15.5 KiB =  19.5 KiB   udevd
  4.0 KiB +  16.0 KiB =  20.0 KiB   mysqld_safe
  4.0 KiB +  25.5 KiB =  29.5 KiB   dbus-daemon
  4.0 KiB +  27.5 KiB =  31.5 KiB   xinetd
 60.0 KiB +  14.5 KiB =  74.5 KiB   epmd
108.0 KiB +  23.0 KiB = 131.0 KiB   init
  8.0 KiB + 135.0 KiB = 143.0 KiB   saslauthd (2)
180.0 KiB +  34.0 KiB = 214.0 KiB   check_scripts.s
796.0 KiB +  41.0 KiB = 837.0 KiB   bash
528.0 KiB + 359.0 KiB = 887.0 KiB   crond (7)
  1.2 MiB + 218.0 KiB =   1.4 MiB   sshd (2)
  1.6 MiB +  45.0 KiB =   1.6 MiB   rsyslogd
  2.0 MiB + 133.0 KiB =   2.1 MiB   beam.smp
  1.3 MiB +   2.3 MiB =   3.6 MiB   httpd (8)
 12.8 MiB + 956.0 KiB =  13.8 MiB   sendmail.sendmail (7)
 53.5 MiB + 114.0 KiB =  53.7 MiB   mysqld
317.6 MiB +   2.3 MiB = 320.0 MiB   python (6)
---------------------------------
                        398.5 MiB
=================================
User
  • 1,365
  • 3
  • 12
  • 17