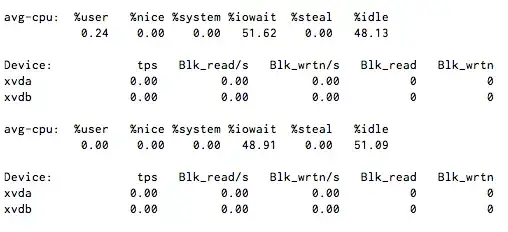
I have CPU I/O wait steady around 50%, but when I run iostat 1 it shows little to no disk activity.
What causes wait without iops?
NOTE: There no NFS or FUSE filesystems here, but it is using Xen virtualization.

I have CPU I/O wait steady around 50%, but when I run iostat 1 it shows little to no disk activity.
What causes wait without iops?
NOTE: There no NFS or FUSE filesystems here, but it is using Xen virtualization.

NFS can do this, and it wouldn't surprise me if other network filesystems (and even FUSE-based devices) had similar effects.
Is there any chance other VMs on the server are thrashing the disk?
I know with virtualisation that you can get some strange results if the host node is overloaded.
If this is the Amazon EC2 Xen environment using instance-based storage, ask Amazon to check the health of the host containing this image.
If this is a Xen environment that you can gain access to the hypervisor, then check the IOwait from without for the disk image (file, network, LVM-slice, whatever) being used for the xvda and xvdb devices. You'll also want to check the I/O system, in general, for the hypervisor since other disk devices might be monopolizing the system's resources.
iostat -txk 5
is usually a good starting diagnostic tool. It takes 5-second summaries of I/O for ALL devices available to it, and thus is useful both with-in and wither-out the VM image.
Check your available file descriptors / inodes. When you hit the limit, they swap and mimic iowait
Edit
I saw you are using xen, have a look at your current interrupts, you might find blkif is higher than normal.
Bit late now, but get munin installed and it will really help future debugging.
sudo sysctl vm.block_dump=1
Then check dmesg to see what is performing block read / writes or dirtying inodes.
Also check nofile limit in limits.conf, a process could be requesting more files than it is permitted to open.
If no other virtual machines are stressing the hard disk(s), do
hdparm -f
on the underlying physical disk(s). Possibly the disk cache don't work accurately. This will flush the data stored in the cache, and you can constantly monitoring the I/O, whether it is about to rise again after the flush. If yes, it will be a cache problem.
With load average, I've seen blocked networking operations (i.e. long calls to an external DB server) increase. I don't know for sure but I'm guessing network IO can cause CPU wait to go up? Can anyone confirm?
On my machines NFS is the biggest IO-WAIT "producer". I have a SSD in my laptop which is fast as hell, so "real IO" is not the problem. Nevertheless I have sometimes lots of IO wait due to my mounted nfs shares.
SCP sometimes also seems to lead to IO Wait but to a far lesser extend.
This can be anything. It just means that something is waiting for end of I/O operation. You can figure out what process it is via ps, then attach gdb to it and check out backtrace to determine which call is hang (usually this is some network-related stuff or suddenly disconnected disk). For fd info, check out /proc.
I've also experienced a similar problem right before a disk in a RAID failed and some SATA cables with tight bends in them started failing.
The CPU usage was near 0%, but 1 or more CPU's on a 4-core system were spending 100% of their time in IOwait for extended periods of time (found via top multi-line cpu display) with very low IOps and bandwidth (found via iostat), but bursty high interrupt activity. Interactive command-line use was painful during any disk access (i.e. auto-save from someone's emacs session) but otherwise tolerable once the periods of IOwait passed (and presumably the operations succeeded after many retries).