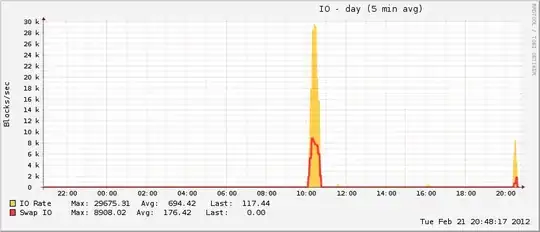
The OOM killer seems to be killing things despite having more than enough free RAM on my system:
27 minutes and 408 processes later, the system started responding again. I rebooted it about an hour after, and soon thereafter the memory utilization returned to normal (for this machine).
Upon inspection, I've got a few interesting processes running on my box:
USER       PID %CPU %MEM    VSZ   RSS TTY      STAT START   TIME COMMAND
[...snip...]
root      1399 60702042  0.2 482288 1868 ?     Sl   Feb21 21114574:24 /sbin/rsyslogd -i /var/run/syslogd.pid -c 4
[...snip...]
mysql     2022 60730428  5.1 1606028 38760 ?   Sl   Feb21 21096396:49 /usr/libexec/mysqld --basedir=/usr --datadir=/var/lib/mysql --user=mysql --log-error=/var/log/mysqld.log --pid-file=/var/run/mysqld/mysqld.pid --socket=/var/lib/mysql/mysql.sock
[...snip...]
This specific server has been running for approx. 8 hours, and these are the only two processes that have such... odd values. My suspicion is that "something else" is going on, potentially relevant to these non-sensical values. In specific, I think that the system thinks that it is out of memory, when in reality, it isn't. After all, it thinks that rsyslogd is using 55383984% CPU consistently, when the theoretical maximum is 400% on this system anyway.
This is a fully up to date CentOS 6 install (6.2) with 768MB of RAM. Any suggestions on how to figure out why this is happening would be appreciated!
edit: attaching the vm. sysctl tunables.. I have been playing with swappiness (made evident by it being 100), and I'm also running an absolutely terrible script which dumps my buffers and cache (made evident by vm.drop_caches being 3) + syncs the disk every 15 minutes. This is why after the reboot, the cached data grew to a somewhat normal size, but then quickly dropped off again. I recognize that having cache is a Very Good Thing, but until I get this figured out...
Also somewhat interesting is that while my pagefile grew during the event, it only reached ~20% of total possible utilization, which is uncharacteristic of true OOM events. On the other end of the spectrum, the disk went absolutely nuts during the same period, which is characteristic of an OOM event when the pagefile is in play.
sysctl -a 2>/dev/null | grep '^vm':
vm.overcommit_memory = 1
vm.panic_on_oom = 0
vm.oom_kill_allocating_task = 0
vm.extfrag_threshold = 500
vm.oom_dump_tasks = 0
vm.would_have_oomkilled = 0
vm.overcommit_ratio = 50
vm.page-cluster = 3
vm.dirty_background_ratio = 10
vm.dirty_background_bytes = 0
vm.dirty_ratio = 20
vm.dirty_bytes = 0
vm.dirty_writeback_centisecs = 500
vm.dirty_expire_centisecs = 3000
vm.nr_pdflush_threads = 0
vm.swappiness = 100
vm.nr_hugepages = 0
vm.hugetlb_shm_group = 0
vm.hugepages_treat_as_movable = 0
vm.nr_overcommit_hugepages = 0
vm.lowmem_reserve_ratio = 256   256     32
vm.drop_caches = 3
vm.min_free_kbytes = 3518
vm.percpu_pagelist_fraction = 0
vm.max_map_count = 65530
vm.laptop_mode = 0
vm.block_dump = 0
vm.vfs_cache_pressure = 100
vm.legacy_va_layout = 0
vm.zone_reclaim_mode = 0
vm.min_unmapped_ratio = 1
vm.min_slab_ratio = 5
vm.stat_interval = 1
vm.mmap_min_addr = 4096
vm.numa_zonelist_order = default
vm.scan_unevictable_pages = 0
vm.memory_failure_early_kill = 0
vm.memory_failure_recovery = 1
edit: and attaching the first OOM message... upon closer inspection, it's saying that something clearly went out of its way to eat the entirety of my swap space as well.
Feb 21 17:12:49 host kernel: mysqld invoked oom-killer: gfp_mask=0x201da, order=0, oom_adj=0
Feb 21 17:12:51 host kernel: mysqld cpuset=/ mems_allowed=0
Feb 21 17:12:51 host kernel: Pid: 2777, comm: mysqld Not tainted 2.6.32-71.29.1.el6.x86_64 #1
Feb 21 17:12:51 host kernel: Call Trace:
Feb 21 17:12:51 host kernel: [<ffffffff810c2e01>] ? cpuset_print_task_mems_allowed+0x91/0xb0
Feb 21 17:12:51 host kernel: [<ffffffff8110f1bb>] oom_kill_process+0xcb/0x2e0
Feb 21 17:12:51 host kernel: [<ffffffff8110f780>] ? select_bad_process+0xd0/0x110
Feb 21 17:12:51 host kernel: [<ffffffff8110f818>] __out_of_memory+0x58/0xc0
Feb 21 17:12:51 host kernel: [<ffffffff8110fa19>] out_of_memory+0x199/0x210
Feb 21 17:12:51 host kernel: [<ffffffff8111ebe2>] __alloc_pages_nodemask+0x832/0x850
Feb 21 17:12:51 host kernel: [<ffffffff81150cba>] alloc_pages_current+0x9a/0x100
Feb 21 17:12:51 host kernel: [<ffffffff8110c617>] __page_cache_alloc+0x87/0x90
Feb 21 17:12:51 host kernel: [<ffffffff8112136b>] __do_page_cache_readahead+0xdb/0x210
Feb 21 17:12:51 host kernel: [<ffffffff811214c1>] ra_submit+0x21/0x30
Feb 21 17:12:51 host kernel: [<ffffffff8110e1c1>] filemap_fault+0x4b1/0x510
Feb 21 17:12:51 host kernel: [<ffffffff81135604>] __do_fault+0x54/0x500
Feb 21 17:12:51 host kernel: [<ffffffff81135ba7>] handle_pte_fault+0xf7/0xad0
Feb 21 17:12:51 host kernel: [<ffffffff8103cd18>] ? pvclock_clocksource_read+0x58/0xd0
Feb 21 17:12:51 host kernel: [<ffffffff8100f951>] ? xen_clocksource_read+0x21/0x30
Feb 21 17:12:51 host kernel: [<ffffffff8100fa39>] ? xen_clocksource_get_cycles+0x9/0x10
Feb 21 17:12:51 host kernel: [<ffffffff8100c949>] ? __raw_callee_save_xen_pmd_val+0x11/0x1e
Feb 21 17:12:51 host kernel: [<ffffffff8113676d>] handle_mm_fault+0x1ed/0x2b0
Feb 21 17:12:51 host kernel: [<ffffffff814ce503>] do_page_fault+0x123/0x3a0
Feb 21 17:12:51 host kernel: [<ffffffff814cbf75>] page_fault+0x25/0x30
Feb 21 17:12:51 host kernel: Mem-Info:
Feb 21 17:12:51 host kernel: Node 0 DMA per-cpu:
Feb 21 17:12:51 host kernel: CPU    0: hi:    0, btch:   1 usd:   0
Feb 21 17:12:51 host kernel: CPU    1: hi:    0, btch:   1 usd:   0
Feb 21 17:12:51 host kernel: CPU    2: hi:    0, btch:   1 usd:   0
Feb 21 17:12:51 host kernel: CPU    3: hi:    0, btch:   1 usd:   0
Feb 21 17:12:51 host kernel: Node 0 DMA32 per-cpu:
Feb 21 17:12:51 host kernel: CPU    0: hi:  186, btch:  31 usd:  47
Feb 21 17:12:51 host kernel: CPU    1: hi:  186, btch:  31 usd:   0
Feb 21 17:12:51 host kernel: CPU    2: hi:  186, btch:  31 usd:   0
Feb 21 17:12:51 host kernel: CPU    3: hi:  186, btch:  31 usd: 174
Feb 21 17:12:51 host kernel: active_anon:74201 inactive_anon:74249 isolated_anon:0
Feb 21 17:12:51 host kernel: active_file:120 inactive_file:276 isolated_file:0
Feb 21 17:12:51 host kernel: unevictable:0 dirty:0 writeback:2 unstable:0
Feb 21 17:12:51 host kernel: free:1600 slab_reclaimable:2713 slab_unreclaimable:19139
Feb 21 17:12:51 host kernel: mapped:177 shmem:84 pagetables:12939 bounce:0
Feb 21 17:12:51 host kernel: Node 0 DMA free:3024kB min:64kB low:80kB high:96kB active_anon:5384kB inactive_anon:5460kB active_file:36kB inactive_file:12kB unevictable:0kB isolated(anon):0kB isolated(file):0kB present:14368kB mlocked:0kB dirty:0kB writeback:0kB mapped:16kB shmem:0kB slab_reclaimable:16kB slab_unreclaimable:116kB kernel_stack:32kB pagetables:140kB unstable:0kB bounce:0kB writeback_tmp:0kB pages_scanned:8 all_unreclaimable? no
Feb 21 17:12:51 host kernel: lowmem_reserve[]: 0 741 741 741
Feb 21 17:12:51 host kernel: Node 0 DMA32 free:3376kB min:3448kB low:4308kB high:5172kB active_anon:291420kB inactive_anon:291536kB active_file:444kB inactive_file:1092kB unevictable:0kB isolated(anon):0kB isolated(file):0kB present:759520kB mlocked:0kB dirty:0kB writeback:8kB mapped:692kB shmem:336kB slab_reclaimable:10836kB slab_unreclaimable:76440kB kernel_stack:2520kB pagetables:51616kB unstable:0kB bounce:0kB writeback_tmp:0kB pages_scanned:2560 all_unreclaimable? yes
Feb 21 17:12:51 host kernel: lowmem_reserve[]: 0 0 0 0
Feb 21 17:12:51 host kernel: Node 0 DMA: 5*4kB 4*8kB 2*16kB 0*32kB 0*64kB 1*128kB 1*256kB 1*512kB 0*1024kB 1*2048kB 0*4096kB = 3028kB
Feb 21 17:12:51 host kernel: Node 0 DMA32: 191*4kB 63*8kB 9*16kB 2*32kB 0*64kB 1*128kB 1*256kB 1*512kB 1*1024kB 0*2048kB 0*4096kB = 3396kB
Feb 21 17:12:51 host kernel: 4685 total pagecache pages
Feb 21 17:12:51 host kernel: 4131 pages in swap cache
Feb 21 17:12:51 host kernel: Swap cache stats: add 166650, delete 162519, find 1524867/1527901
Feb 21 17:12:51 host kernel: Free swap  = 0kB
Feb 21 17:12:51 host kernel: Total swap = 523256kB
Feb 21 17:12:51 host kernel: 196607 pages RAM
Feb 21 17:12:51 host kernel: 6737 pages reserved
Feb 21 17:12:51 host kernel: 33612 pages shared
Feb 21 17:12:51 host kernel: 180803 pages non-shared
Feb 21 17:12:51 host kernel: Out of memory: kill process 2053 (mysqld_safe) score 891049 or a child
Feb 21 17:12:51 host kernel: Killed process 2266 (mysqld) vsz:1540232kB, anon-rss:4692kB, file-rss:128kB

