3

I run a CentOS 5.7 64 machine with 24gb ram and running kernel 2.6.18-274.12.1.el5.

This machine runs only Nginx, php-fpm and Xcache as extra applications.

Since about 3 weeks my memory behavior on this machine has changed and I cannot explain why. There are no crons running which flush anything like this. There are also no large numbers of files being deleted/changed during these drops.

The 'cached' memory gets dropped about every few hours, but it's never a set gap between flushes, this indicates to me that some bottleneck gets reached instead. It also always seems to be when total memory usages gets to about 18GB, but again, not always exactly 18GB.

This is a graph of my memory usage: enter image description here

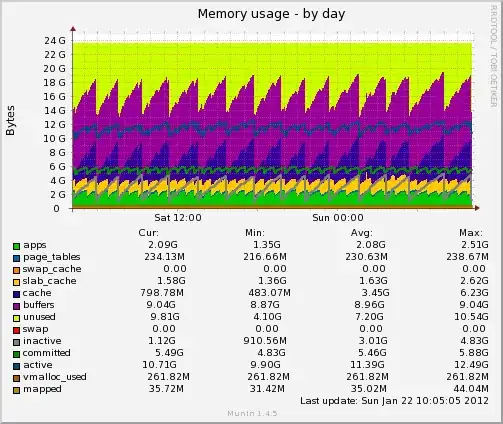
As you can see in the graph the 'buffers' always stay more or less the same, it is mainly the 'cache' that gets dropped.

Running vmstat -m I have outputted the memory usage just before and just after a memory drop. The output is here: http://pastebin.com/diff.php?i=hJqZqztm 'old version' being before, 'new version' being after a drop.

About 3 weeks ago my server crashed during a heavy DDOS attack, after I rebooted the machine this odd behavior started. I have checked a bunch of logs, restarted the machine again, and cannot find any indication what changed.

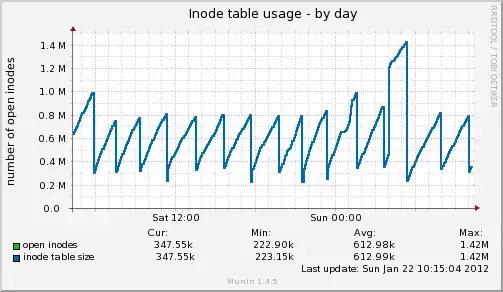
During these 'cache' memory drops, my iNode usage drops at the same time.

enter image description here

Does anyone have any idea what might be causing this behavior? Clearly my RAM isn't full, so I am curious why this could be happening.

Mr.Boon
  • 1,441
  • 4
  • 24
  • 41
  • Your 'buffers' value is really really high. That metric (although commonly misinterprested as dirty writes) is in effect block-device cache (if you cat /dev/sda that value will go up). It also could go up if you have lots of filesystems or LVM/Raid going on. But, 9G is enormous. What type of media setup do you use? FYI on most servers I rarely see that value go over 1G, let alone 9G. – Matthew Ife Jan 22 '12 at 17:40
  • This server hosts over 25 million text files (usually a only a few kb each, spread over 4x sas 15k rpm drives in raid10 setup), those files are spread in a /25/25/25/25/ folder structure. And these files are requested via PHP script quite often. 2 files are requested per page, and about 30 pages per second. As far as I understand Linux caches the most accessed files in the RAM. Storing these files a MySQL DB was no option as the DB size would be too big. But nothing has changes in the structure since the last 3 weeks, so the change in memory behavior is a mystery to us. – Mr.Boon Jan 22 '12 at 18:35
  • Does your disk I/O correllate with this behaviour? – Matthew Ife Jan 22 '12 at 18:48
  • Yes it does. When 'cache' is flushed, more info will need to come directly from disk, so there are 'read' spikes. You can see it here: http://i.imgur.com/3mmDi.png. This shouldn't have to happen if the server wouldn't flush that cache. – Mr.Boon Jan 22 '12 at 18:51
  • I have to admit the graph confuses me (I dont use munin). The text stats indicate a min/max of buffers to be 8.87G to 9.04G respectively, but the graph displays a number of spikes between 13G and 18G. Perhaps I am reading the legend wrong here? And, which is actually right, the graph or the text summary.. I guess the graph on the basis of what your I/O chart shows. – Matthew Ife Jan 22 '12 at 19:01
  • Do you have the memory profile graph before the incident? – Matthew Ife Jan 22 '12 at 20:18
  • Yes I do, it clearly show the reboot of the machine also. http://i.imgur.com/ZDlTA.png after that it started. This graph is from a month, so it's less detailed, and showing more average. But you can still see the spikiness that started after the reboot. – Mr.Boon Jan 22 '12 at 20:39
  • Still no solution for my problem :( – Mr.Boon Feb 06 '12 at 18:49
  • Again I dont use munin but if I take the peaks of active+inactive+cache this goes above the total of 24G which would explain mysterious dropping of cache. Do you have SAR installed and if so can you provide a link to the output of sar -r? – Matthew Ife Feb 06 '12 at 22:15
  • Hello, this is the output of sar. http://pastebin.com/C4D0B79i – Mr.Boon Feb 06 '12 at 22:27
  • Whats fascinating about that output is it suggests to me as if only 16G of memory is being utilized out of the 24G you have. What is the physical configuration of the ram in that box? – Matthew Ife Feb 06 '12 at 23:42
  • Hmm, can you paste your php-fpm configuration file, your nginx server config, and your xcache config? As well, can you paste the output of lsof both before and after an cache/buffer clear? – Justin Lynn Feb 07 '12 at 06:30
  • I have put my configs here: https://pastebin.com/iEWJchc4 and the output of LSOF here: http://hostlogr.com/lsof.txt. The thing i do notice the VERY large number of php-fpm processes that go to /dev/zero. Which is specified in my xcache configuration. Could that possibly be wrong? – Mr.Boon Feb 07 '12 at 08:31
  • It is clearly going over 16GB, so I dont believe that is a limit. I have put my configs here: https://pastebin.com/iEWJchc4 and the output of LSOF here: http://hostlogr.com/lsof.txt. The thing i do notice the VERY large number of php-fpm processes that go to /dev/zero. Which is specified in my xcache configuration. Could that possibly be wrong? – Mr.Boon Feb 07 '12 at 08:34
  • If you got back all the way through the days does the SAR output show going over 16G then? SAR does not show it going over 16G so far. The /dev/zero attachment is a mmap trick to allocate privately zeroed mmap space. I dont think it is that. – Matthew Ife Feb 07 '12 at 16:50
  • Okay, so, about how many requests per second is this server handling? I'm also somewhat curious if you're php backends aren't being restarted by php-fpm all around the same point. Can you do a `ps aux` before and after the cache clear? – Justin Lynn Feb 08 '12 at 01:27
  • Hello, I have been running sar -r a few more times, and it does indeed go over 16GB sometimes. Sometimes even 17GB. – Mr.Boon Feb 08 '12 at 08:37
  • Yes it does even go over 17GB at one point. – Mr.Boon Feb 08 '12 at 08:39

2 Answers2

1

What does a jagged committed memory graph mean?

Sockets create inodes when a connection is accept()-ed, so the inode behaviour could be from a massive burst of connections being opened or closed, respectively. This could happen when (as in the linked question) logrotate kills a bunch of FastCGI processes. Not sure if this would apply to php-fpm.

Just a wild theory, and it doesn't really explain why the cache is cleared at the same time. Still, could be worth a look?

Simon Lindgren
  • 264
  • 1
  • 2
  • 9
0

solved it by putting vm.zone_reclaim_mode = 0

Mr.Boon
  • 1,441
  • 4
  • 24
  • 41