21

we are trying to investigate memory usage of java process under moderate load.

  PID   USER    PR  NI  VIRT  RES  SHR S %CPU %MEM    TIME+  COMMAND
  12663 test    20   0 8378m 6.0g 4492 S   43  8.4 162:29.95 java

As you can see we have resident memory at 6Gb. Now the interesting part is this: the process is executed with these params:

  • -Xmx2048m
  • -Xms2048m
  • -XX:NewSize=512m
  • -XX:MaxDirectMemorySize=256m
  • ... some others for GC and stuff

Looking at these settings and at actual memory usage we are stumbled to see the difference of what we expect this process to be using and what it actually uses.

Usually our memory problems are solved by analyzing heap dump but in this case our memory is used somewhere outside heap.

Questions: What would be the steps to try and find the reason of such a high memory usage? What tools could help us identifying what uses the memory in that process?

EDIT 0

It doesn't look like this is a heap related problem as we still have quite some space there:

jmap -heap 12663

results in (edited to save space)

Heap Configuration:
MinHeapFreeRatio = 40
MaxHeapFreeRatio = 70
MaxHeapSize      = 2147483648 (2048.0MB)
NewSize          = 536870912 (512.0MB)
MaxNewSize       = 536870912 (512.0MB)
OldSize          = 1610612736 (1536.0MB)
NewRatio         = 7
SurvivorRatio    = 8
PermSize         = 21757952 (20.75MB)
MaxPermSize      = 85983232 (82.0MB)

New Generation: 45.7% used
Eden Space: 46.3% used
From Space: 41.4% used
To Space: 0.0% used
concurrent mark-sweep generation: 63.7% used
Perm Generation: 82.5% used

EDIT 1

using the pmap we can see that there are quite some amount of allocations of 64Mb:

pmap -x 12663 | grep rwx | sort -n -k3 | less

results in:

... a lot more of these 64Mb chunks
00007f32b8000000       0   65508   65508 rwx--    [ anon ] <- what are these?
00007f32ac000000       0   65512   65512 rwx--    [ anon ]
00007f3268000000       0   65516   65516 rwx--    [ anon ]
00007f3324000000       0   65516   65516 rwx--    [ anon ]
00007f32c0000000       0   65520   65520 rwx--    [ anon ]
00007f3314000000       0   65528   65528 rwx--    [ anon ] 
00000000401cf000       0  241904  240980 rwx--    [ anon ] <- Direct memory ?
000000077ae00000       0 2139688 2139048 rwx--    [ anon ] <- Heap ?

So how to find out what are those 64Mb chunks? What is using them? What kind of data is in them?

Thanks
Konstantin S.
  • 316
  • 1
  • 3
  • 7
  • 2
    I got exactly the same problem... here is my question. http://stackoverflow.com/questions/18734389/huge-memory-allocated-outside-of-java-heap Do you have a solution about this? – DeepNightTwo Sep 13 '13 at 09:22
  • See also [What is the memory footprint of the JVM and how can I minimize it?](http://stackoverflow.com/questions/38552250/what-is-the-memory-footprint-of-the-jvm-and-how-can-i-minimize-it) – Vadzim Sep 12 '16 at 16:56

6 Answers6

24

The issue might be related to this glibc issue.

Basically, when you have multiple threads allocating memory, glibc will scale up the number of available arenas to do allocation from to avoid lock contention. An arena is 64Mb large. The upper limit is to create 8 times the numeber of cores arenas. Arenas will be created on demand when a thread access an arena that is already locked so it grows with time.

In Java where you sprinkle with threads, this can quickly lead to a lot of arenas being created. And there being allocations spread all over these arenas. Initially each 64Mb arena is just mapped uncomitted memory, but as you do allocations you start to use actual memory for them.

Your pmap likely have listings similar to this below. Notice how 324K + 65212K = 65536K, 560K + 64976K == 65536K, 620K + 64916K == 65536K. That is, they sum up to 64Mb.

00007f4394000000    324K rw---    [ anon ]
00007f4394051000  65212K -----    [ anon ]
00007f4398000000    560K rw---    [ anon ]
00007f439808c000  64976K -----    [ anon ]
00007f439c000000    620K rw---    [ anon ]
00007f439c09b000  64916K -----    [ anon ]

As for workarounds: The bug mention some environment parameters you can set to limit the number of arenas, but you need a glibc version high enough.

Christian
  • 341
  • 2
  • 5
  • 5
    setting Xmx and Xms to the same value, plus setting the environment variable "export MALLOC_ARENA_MAX=4" in the sh script that start our web service helped in our case. Before that we were experiencing web service restarts due to OOM Killer every 2 to 8 hours. GLIBC version in Ubuntu 14.04 is 2.19 which is good, since it needs to be >= 2.16 for the MALLOC_ARENA_MAX setting to work – Kluyg Apr 22 '15 at 21:37
  • This answer and the above comment were a lifesaver for me. In my case MALLOC_ARENA_MAX=1 was necessary and effective. – John Bachir Nov 02 '15 at 17:47
3

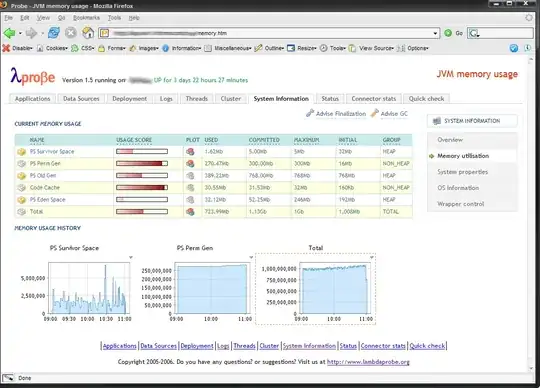
How about Lamdba Probe? Among other things it can show you memory usage breakdowns similar to screenshot below:

Lambda Probe memory usage view

Sometimes pmap -x your_java_pid can also be helpful.

Janne Pikkarainen
  • 31,454
  • 4
  • 56
  • 78
  • Thanks for your answer. If I understand correctly then Lambda Probe is for Apache Tomcat? Which we don't use... Regarding the pmap I'll add the info to the top post – Konstantin S. Dec 16 '11 at 12:07
2

JProfiler could be something you seek but it's not free. Another good and free tool to investigate the memory usage of java process is Java VisualVM available as a JDK tool in Oracle/Sun JDK distributions. I'd personally recommend more holistic approach to the problem (i.e. to monitor JDK + OS + disks, etc) – the use of some network monitoring system - Nagios, Verax NMS or OpenNMS.

xantross
  • 46
  • 1
2

The problem is outside the heap, so best candidate are:

JNI leak  
Allocation of direct memory buffer

Due to the fact you have limited the direct buffer size, best candidate in my opinion is JNI leak.

slm
  • 7,355
  • 16
  • 54
  • 72
Venceslas
  • 21
  • 2
1

There is a handy tool to view the allocation of the heap memory included in the JDK called jmap, on top of this you also have stack etc (Xss). Run these two jmap commands to get more information about memory usage:

jmap -heap <PID>
jmap -permstat <PID>

To get more even more information you can connect to the process with jconsole (also included in the JDK). Jconsole however requres JMX to be configured in the application.

HampusLi
  • 3,398
  • 15
  • 14
  • Thanks for your answer but the problem seems to be somewhere outside heap. I will update top post to reflect some information from jmap – Konstantin S. Dec 16 '11 at 12:30
  • How many threads does the process have? Stack size is 2MB default on most platforms, so multiply that with the number of threads. I'd be surprised if it accounts for all the "missing" memory but at possibly some of it. – HampusLi Dec 16 '11 at 12:33
  • About 300 threads, taken information from pmap we have stack size of 1Mb. And from the same pmap output it doesn't look like any of those stacks use more than 100Kb – Konstantin S. Dec 16 '11 at 12:37
0

Use JVisualVM. It have various different views that will tell you how much heap memory is in use, PermGen and so on and on.

As for answering your question. Java handles memory quite differently from what you might expect.

When you set the -Xms and -Xmx paramters, you are telling the JVM how much memory it should allocate in the heap to start with and also how much it should allocate as a maximum.

If you have a java application that used a total of 1m of memory but passed in -Xms256m -Xmx2g then the JVM will initialise itself with 256m of memory used. It will not use less than that. It does not matter that your application uses only 1m of memory.

Secondly. In the above case, if you app at some point uses more than 256m of memory, the JVM will allocate as much memory as necessary to service the request. However, it will not drop the heap size back to the minimum value. At least, not under most circumstances.

In your case, since you are setting minimum and maximum memory to be at 2g, the JVM will allocate 2g at the start and maintain it.

Java memory management is quite complex and tuning memory usage can be a task in itself. There are however, lots of resources out there that may help.

drone.ah
  • 482
  • 2
  • 6