3

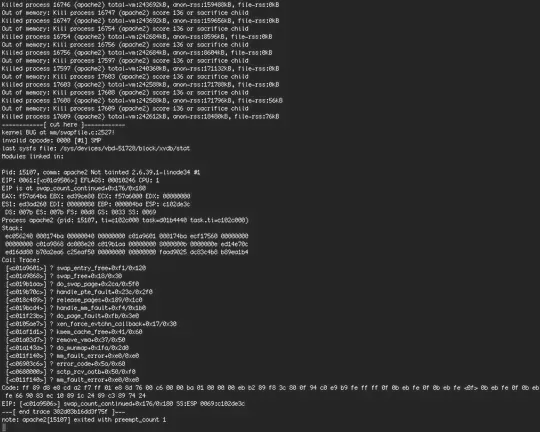
I have a VPS with Linode right now. I was alerted by my monitoring service that a site I was hosting had gone down. I used Lish, Linode's method of getting direct out-of-band access to the console over an SSH connection but without using SSH, to see any error messages. This is what I saw:

console log

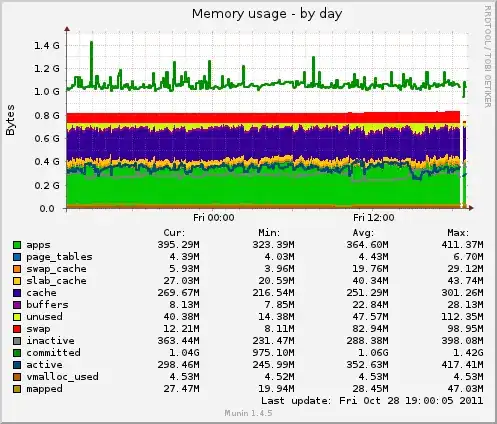
I checked my Munin logs to see if there was a spike in memory usage, and indeed there is a spike at the appropriate time for the swap graph:

swap memory spike

However, there was no spike on the memory graph (although swap does seem to be rising slightly):

memory graph, no spike

I restarted the server and it has been working fine since. I checked Apache access and error logs and saw nothing suspicious. The last entry in syslog prior to the server restart was an error with the IMAP daemon and does not appear to be related:

Oct 28 18:30:35 hostname imapd: TIMEOUT, user=user@xxxxxxxxxxxxx.com, ip=[::ffff:XX.XX.XX.XX], headers=0, body=0, rcvd=195, sent=680, time=1803
# all of the startup logs below here
Oct 28 18:40:33 hostname kernel: imklog 5.8.1, log source = /proc/kmsg started.

I tried checking dmesg but didn't see anything suspicious either. The last few lines:

VFS: Mounted root (ext3 filesystem) readonly on device 202:0.
devtmpfs: mounted
Freeing unused kernel memory: 412k freed
Write protecting the kernel text: 5704k
Write protecting the kernel read-only data: 1384k
NX-protecting the kernel data: 3512k
init: Failed to spawn console-setup main process: unable to execute: No such file or directory
udevd[1040]: starting version 173
Adding 524284k swap on /dev/xvdb.  Priority:-1 extents:1 across:524284k SS
init: udev-fallback-graphics main process (1979) terminated with status 1
init: plymouth main process (1002) killed by SEGV signal
init: plymouth-splash main process (1983) terminated with status 2
EXT3-fs (xvda): using internal journal
init: plymouth-log main process (2017) terminated with status 1
init: plymouth-upstart-bridge main process (2143) terminated with status 1
init: ssh main process (2042) terminated with status 255
init: failsafe main process (2018) killed by TERM signal
init: apport pre-start process (2363) terminated with status 1
init: apport post-stop process (2371) terminated with status 1

I tried Googling the error message (kernel BUG at mm/swapfile.c:2527!) and found a few Xen related topics (Linode uses Xen):

However, none of the information I found seemed to point to any solution. I am going to upgrade to the latest kernel Linode offers (from 2.6.39.1-linode34 to 3.0.4-linode38).

Is there anything else I can do to diagnose this problem now, or in the future if it should happen again? Is there anything I missed? Does anybody have ideas for what may have triggered this?

Please let me know if there's any other information I can provide. Thanks a ton.

Tom Marthenal
  • 2,106
  • 7
  • 25
  • 37

2 Answers2

2

Did you pull the Munin graphs before or after you rebooted the system? If after, the part after the blank section is likely AFTER you rebooted, and is irrelevant. I would guess it's after, because your swap use has dramatically dropped...

In your question you are ignoring the blank section... You say "the graph doesn't show memory usage going up", but what they really show is no data during the time when memory was likely going up. munin is a great tool, but it is terrible at reporting instances like this, because it only reports information every 5 minutes and if the system is busy it may not report anything at all.

Have you done the memory math for the number of instances of Apache you can run? By this I mean do "ps awwlx --sort=rss | grep apache" and look at how much memory each Apache instance is using. For example:

root@theobromine:~# ps awwlx --sort=rss | grep apache
0     0 18497 18485  20   0   1788   528 -      S+   pts/0      0:00 grep apache
5    33 18458  5384  20   0  28468  6700 -      S    ?          0:00 /usr/sbin/apache2 -k start
5    33 18470  5384  20   0  28468  6700 -      S    ?          0:00 /usr/sbin/apache2 -k start
5    33 18480  5384  20   0  28468  6700 -      S    ?          0:00 /usr/sbin/apache2 -k start
5    33 18481  5384  20   0  28468  6700 -      S    ?          0:00 /usr/sbin/apache2 -k start
5    33 18457  5384  20   0  28468  6708 -      S    ?          0:00 /usr/sbin/apache2 -k start
5     0  5384     1  20   0  28336 11796 -      Ss   ?          0:16 /usr/sbin/apache2 -k start

It is that 8th column we're looking at. In this case it is using 6.7MB for each instance, which is actually fairly small. But now I look at how much memory I have:

root@theobromine:~# free
             total       used       free     shared    buffers     cached
Mem:        775196     643848     131348          0      77964     268788
-/+ buffers/cache:     297096     478100
Swap:      1148636       3368    1145268

So I have 800MB of RAM... Now, I can do the math and say that in the best case I can run 800/6.7 = 119 instances of Apache. But that doesn't leave any space for any other applications or the OS or cache, etc...

But actually you have 478MB (second column under "free") at most, minus the amount of currently running Apaches (6.7*6 -- I only had 6 Apache instances running above), leaving around 520MB of RAM (if leaving you with no cache, of course). So the max I can really run is more like 77 instances.

So how many am I actually running?

root@theobromine:~# grep MaxClients /etc/apache2/apache2.conf
# MaxClients: maximum number of server processes allowed to start
    MaxClients          150
# MaxClients: maximum number of simultaneous client connections
    MaxClients          150

Ah, Apache isn't limiting me to less memory than I have. So, if more than 77 clients connect to my web server at once, I'm likely to start thrashing.

I see this quite frequently: "I need to be able to handle 500 simultaneous web connections." But then you look at their Apache instances and they are using 60MB (not an uncommonly large size), but then they freak out when you say they need to upgrade their VPS to 32BG of RAM. :-)

Sean Reifschneider
  • 10,370
  • 3
  • 24
  • 28
  • +1 Thanks a lot for the help. The problem ended up being related to a bug in Xen (see my accepted answer). Updating to the latest Xen kernel solved the problem. I'll definitely make sure to check the load my Apache setup will be able to handle. – Tom Marthenal Oct 30 '11 at 22:32
2

The problem was related to the bug in Xen (mentioned in the question). Updating to the latest version of the kernel (3.0.4-linode38) solved the issues (the server was repeatedly crashing until I changed the kernel version). The problems appear to have been caused not due to lack of memory but instead mismanagement of memory by the kernel (or some bug in Xen).

Tom Marthenal
  • 2,106
  • 7
  • 25
  • 37