The setup is
- EC2 Micro instance
- Nginx 1.0.0.5 with FPM
- PHP 5.2.17 with CGI
- App connects to MySQL on RDS
- Collectd for monitoring
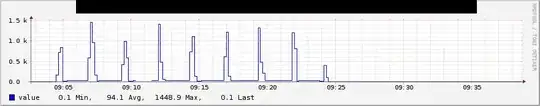
JMeter is used on other servers on same EC2 region (so latency is not an issue). The problem is from the graph generated by Collectd, results are VERY spikey.
For example, 200k requests took 20 minutes, and the pattern is like 1k requests for 1 minute, then pretty much flat (not even 100) requests for 2 minutes, repeat.
The only resource that reached the limit here is CPU at 100%. The rest are still not fully-utilized.
Heck, I've tried on static page before and get pretty much the same pattern:
HUGE spike - flat - flat - HUGE spike
What am I overlooking here? Some stuff I've taken care of:
- rlimit set to very high
- nginx worker connection set to 8192
- PHP-FPM max children set to 140
Below is said graph from one of the runs (200,000 requests total)
Thanks.