89

The rate at which my server can accept() new incoming TCP connections is really bad under Xen. The same test on bare metal hardware shows 3-5x speed ups.

  1. How come this is so bad under Xen?
  2. Can you tweak Xen to improve performance for new TCP connections?
  3. Are there other virtualization platforms better suited for this kind of use-case?

Background

Lately I've been researching some performance bottlenecks of an in-house developed Java server running under Xen. The server speaks HTTP and answers simple TCP connect/request/response/disconnect calls.

But even while sending boatloads of traffic to the server, it cannot accept more than ~7000 TCP connections per second (on an 8-core EC2 instance, c1.xlarge running Xen). During the test, the server also exhibit a strange behavior where one core (not necessarily cpu 0) gets very loaded >80%, while the other cores stay almost idle. This leads me to think the problem is related to the kernel/underlying virtualization.

When testing the same scenario on a bare metal, non-virtualized platform I get test results showing TCP accept() rates beyond 35 000/second. This on a Core i5 4 core machine running Ubuntu with all cores almost fully saturated. To me that kind of figure seems about right.

On the Xen instance again, I've tried enable/tweak almost every settings there is in sysctl.conf. Including enabling Receive Packet Steering and Receive Flow Steering and pinning threads/processes to CPUs but with no apparent gains.

I know degraded performance is to be expected when running virtualized. But to this degree? A slower, bare metal server outperforming virt. 8-core by a factor of 5?

  1. Is this really expected behavior of Xen?
  2. Can you tweak Xen to improve performance for new TCP connections?
  3. Are there other virtualization platforms better suited for this kind of use-case?

Reproducing this behavior

When further investigating this and pinpointing the problem I found out that the netperf performance testing tool could simulate the similar scenario I am experiencing. Using netperf's TCP_CRR test I have collected various reports from different servers (both virtualized and non-virt.). If you'd like to contribute with some findings or look up my current reports, please see https://gist.github.com/985475

How do I know this problem is not due to poorly written software?

  1. The server has been tested on bare metal hardware and it almost saturates all cores available to it.
  2. When using keep-alive TCP connections, the problem goes away.

Why is this important?

At ESN (my employer) I am the project lead of Beaconpush, a Comet/Web Socket server written in Java. Even though it's very performant and can saturate almost any bandwidth given to it under optimal conditions, it's still limited to how fast new TCP connections can be made. That is, if you have a big user churn where users come and go very often, many TCP connections will have to be set up/teared down. We try to mitigate this keeping connections alive as long as possible. But in the end, the accept() performance is what keeps our cores from spinning and we don't like that.


Update 1

Someone posted this question to Hacker News, there's some questions/answers there as well. But I'll try keeping this question up-to-date with information I find as I go along.

Hardware/platforms I've tested this on:

  • EC2 with instance types c1.xlarge (8 cores, 7 GB RAM) and cc1.4xlarge (2x Intel Xeon X5570, 23 GB RAM). AMIs used was ami-08f40561 and ami-1cad5275 respectively. Someone also pointed out that the "Security Groups" (i.e EC2s firewall) might affect as well. But for this test scenario, I've tried only on localhost to eliminate external factors such as this. Another rumour I've heard is that EC2 instances can't push more than 100k PPS.
  • Two private virtualized server running Xen. One had zero load prior to the test but didn't make a difference.
  • Private dedicated, Xen-server at Rackspace. About the same results there.

I'm in the process of re-running these tests and filling out the reports at https://gist.github.com/985475 If you'd like to help, contribute your numbers. It's easy!

(The action plan has been moved to a separate, consolidated answer)
Jonas
  • 1,147
  • 5
  • 17
  • 31
cgbystrom
  • 1,061
  • 1
  • 9
  • 9
  • 3
    Excellent job pinpointing to an issue, but I believe you'd be served much better on a Xen-specific mailing list, support forum or even the [xensource bug report site](http://bugzilla.xensource.com/). I believe this could be some scheduler bug - if you take your numbers of 7,000 connections * 4 cores / 0.80 CPU load you get exactly 35,000 - the number you'd get when 4 cores would be fully saturated. – the-wabbit May 22 '11 at 19:03
  • Ah, and one more thing: try a different (more recent perhaps) kernel version for your guest, if you can. – the-wabbit May 22 '11 at 19:13
  • @syneticon-dj Thanks. I did try it on a cc1.4xlarge at EC2 with kernel 2.6.38. I saw around a ~10% increase if I'm not mistaken. But it's more likely due to the beefier hardware of that instance type. – cgbystrom May 22 '11 at 20:40
  • 6
    thanks for keeping this up to date with the HN responses, it's a great question. I suggest moving the action plan into a consolidated answer, possibly -- as these are all possible answers to the problem. – Jeff Atwood May 22 '11 at 22:57
  • @jeff Move the action plan, check. – cgbystrom May 22 '11 at 23:56

4 Answers4

27

Right now: Small packet performance sucks under Xen

(moved from the question itself to a separate answer instead)

According to a user on HN (a KVM developer?) this is due to small packet performance in Xen and also KVM. It's a known problem with virtualization and according to him, VMWare's ESX handles this much better. He also noted that KVM are bringing some new features designed alleviate this (original post).

This info is a bit discouraging if it's correct. Either way, I'll try the steps below until some Xen guru comes along with a definitive answer :)

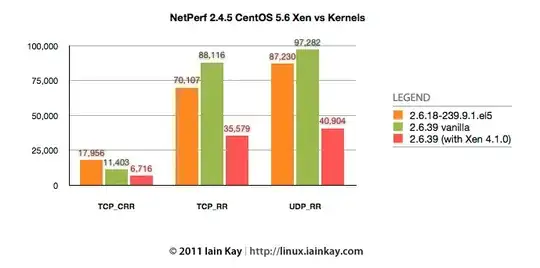
Iain Kay from the xen-users mailing list compiled this graph: netperf graph Notice the TCP_CRR bars, compare "2.6.18-239.9.1.el5" vs "2.6.39 (with Xen 4.1.0)".

Current action plan based on responses/answers here and from HN:

  1. Submit this issue to a Xen-specific mailing list and the xensource's bugzilla as suggested by syneticon-dj A message was posted to the xen-user list, awaiting reply.

  2. Create a simple pathological, application-level test case and publish it.
    A test server with instructions have been created and published to GitHub. With this you should be able to see a more real-world use-case compared to netperf.

  3. Try a 32-bit PV Xen guest instance, as 64-bit might be causing more overhead in Xen. Someone mentioned this on HN. Did not make a difference.

  4. Try enabling net.ipv4.tcp_syncookies in sysctl.conf as suggested by abofh on HN. This apparently might improve performance since the handshake would occur in the kernel. I had no luck with this.

  5. Increase the backlog from 1024 to something much higher, also suggested by abofh on HN. This could also help since guest could potentially accept() more connections during it's execution slice given by dom0 (the host).

  6. Double-check that conntrack is disabled on all machines as it can halve the accept rate (suggested by deubeulyou). Yes, it was disabled in all tests.

  7. Check for "listen queue overflow and syncache buckets overflow in netstat -s" (suggested by mike_esspe on HN).

  8. Split the interrupt handling among multiple cores (RPS/RFS I tried enabling earlier are supposed to do this, but could be worth trying again). Suggested by adamt at HN.

  9. Turning off TCP segmentation offload and scatter/gather acceleration as suggested by Matt Bailey. (Not possible on EC2 or similar VPS hosts)

cgbystrom
  • 1,061
  • 1
  • 9
  • 9
  • 2
    +1 Definitely post the performance results when you've found out! – chrisaycock May 23 '11 at 00:47
  • Someone poked me on Twitter regarding this question. Unfortunately, it seems as this problems persist. I haven't put much research into since last year. Xen MAY have improved during this time, I don't know. The KVM developer also mentioned they were addressing issues like this. Could be worth pursuing. Also, another recommendation I've heard is to try OpenVZ instead of Xen/KVM as it add less or no layering/interception of syscalls. – cgbystrom Mar 20 '12 at 08:52
21

Anecdotally, I found that turning off NIC hardware acceleration vastly improves network performance on the Xen controller (also true for LXC):

Scatter-gather accell:

/usr/sbin/ethtool -K br0 sg off

TCP Segmentation offload:

/usr/sbin/ethtool -K br0 tso off

Where br0 is your bridge or network device on the hypervisor host. You'll have to set this up to turn it off at every boot. YMMV.

Matt Bailey
  • 211
  • 1
  • 3
  • I second this. I had a Windows 2003 server running on Xen that suffered some horrible packet loss problems under high throughput conditions. The problem went away when i disabled TCP segment offload – rupello May 22 '11 at 19:24
  • Thanks. I updated the "action plan" in the original question with your suggestions. – cgbystrom May 22 '11 at 21:39
  • see also http://cloudnull.io/2012/07/xenserver-network-tuning/ – Lari Hotari Mar 10 '14 at 07:34
  • I wonder: Is that the classic "throughput vs. response time"? For just counting accept rates "response time" may be "throughput" here, but for large data transfers things may be different (I guess). – U. Windl Nov 02 '20 at 08:07
3

Maybe you could clarify a little bit - did you run the tests under Xen on your own server, or only on an EC2 instance ?

Accept is just another syscall, and new connections are only different in that the first few packets will have some specific flags - an hypervisor such as Xen should definitely not see any difference. Other parts of your setup might: in EC2 for instance, I would not be surprised if Security Groups had something to do with it; conntrack is also reported to halve new connections accept rate (PDF).

Lastly, there seem to be CPU/Kernel combinations that cause weird CPU usage / hangups on EC2 (and probably Xen in general), as blogged about by Librato recently.

deubeulyou
  • 131
  • 3
  • I updated the question and clarified what hardware I've tried this on. abofh also suggested increasing the backlog beyond 1024 to speed up the number of possible accept()s during an execution slice for the guest. Regarding conntrack, I should definitely double-check that such things are disabled, thanks. I've read that Liberato article but given the amount of different hardware I tried this on, it shouldn't be the case. – cgbystrom May 22 '11 at 20:57
  • One thing to watchout for is that under PVM Xen, the guest load numbers only tell half of the truth: Usually you'd have to watch the hypervisor's load numbers, too. Specifically watching the (rather newly (since Linux 2.6.11) added) "steal rate" (field 8 in `/proc/stat`) in the guest may be interesting. – U. Windl Nov 02 '20 at 08:13
0

Make sure you disabled iptables and other hooks in bridging code in dom0. Obviously it only applies to bridge networking Xen setup.

echo 0 > /proc/sys/net/bridge/bridge-nf-call-ip6tables
echo 0 > /proc/sys/net/bridge/bridge-nf-call-iptables
echo 0 > /proc/sys/net/bridge.bridge-nf-call-arptables

It depends on size of the server but on smaller ones (4-core processor) dedicate one cpu core to Xen dom0 and pin it. Hypervisor boot options:

dom0_max_vcpus=1 dom0_vcpus_pin dom0_mem=<at least 512M>

Did you tried to pass physical ethernet PCI device to domU? There should be nice performance boost.

kupson
  • 3,388
  • 18
  • 18