1

I have got a unique problem with one of my servers. The disk I/O statistic is consistently increasing for last couple of weeks. See this graph from Munin:

enter image description here

From Linode's dashboard, I see a more fine-grained picture of disk I/O. Here is the cyclical / rhythmic graph (a day's interval). But do note that even though it appears cyclical, over a period of weeks, average disk I/O is increasing consistently (see above graph):

enter image description here

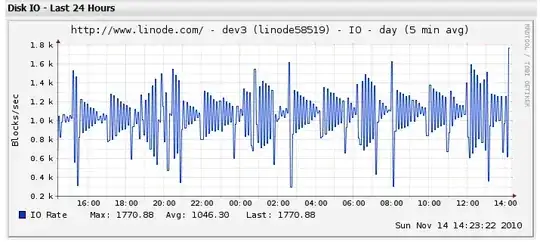
Now, I did iotop and saw that kjournald is the only process doing writing for disk I/O (apart from the occassional rsyslogd -- but the frequency of disk I/O of kjournald is much, much higher). In the graphs above, the read component of I/O is practically zero.

Why is kjournald writing even when there is no other process writing? Why is size of writes getting larger by the day?

Another clue: free memory is also monotonically decreasing while "buffers" is increasing. See this graph:

enter image description here

PS: the server is Apache only. Access logs are disabled, but error logs are enabled. Serving about 80 requests/second. We use Redis as queue. My disk is using ext3.

Peter Mortensen
  • 2,319
  • 5
  • 23
  • 24
Paras Chopra
  • 543
  • 1
  • 5
  • 14

2 Answers2

1

Wild shot in the dark, since I have no idea what your server is doing:

Is your server a web server? Perhaps it has a frequently visited page which logs accesses to regular text file (or, perhaps, SQLite backend?) and a PHP script parses this file during every page load & records to visit to this file? Then this file grows and grows and so does the amount of writes.

Though this seems unlikely since you are not observing any httpd processes. Anyway, perhaps something similar is going on? Some regularly analyzed file is growing and growing?

EDIT: Have you already tried an extremely handy tool blktrace? With that you can trace the I/O and see what processes are accessing the disk and why. Try btrace /dev/sda or whatever your disk is. btrace command is bundled with blktrace package at least in Debian/Ubuntu, if it is not already installed for you.

Janne Pikkarainen
  • 31,454
  • 4
  • 56
  • 78
1

First and foremost I always have a problem looking at data that has been monitored too infrequently as there is often some very useful information hidden between sampling periods. However that may not necessarily be a problem here.

In any event, one counter rarely tells the whole story. Since your daily plot does show a slight increase during the day at least things are changing rapidly enough to see change. What you can't tell from your plots, because they're NOT fine-grained enough, are things changing smoothly or perhaps in a step function? Is a value flat for 50 seconds and then jumps? You just can't tell and if there are jumps, you need to be able to correlate that to other system measurements.

I'd recommend installing collectl and letting it run for a couple of hours. Then using colplot, which is part of collectl-utils, you can get detailed plots (at 10-second intervals) of cpu, disk, network, memory, nfs, tcp, sockets and probably one or two things I forgot. You can also dig into what's happening with your slabs and processes.

Now you can look at those plots and see in far greater detail than you'll ever see with the plots you're getting from rrdtool. Of course if something looks interesting in a plot you can also replay the collected as time-stamped text and dig into that too.

-mark