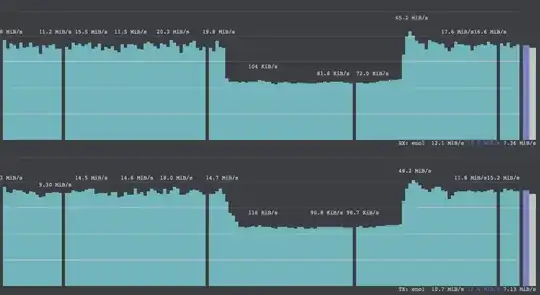
I have this debian 10 box as a part of my cluster. Monitoring tools show a dip to 0/pause in traffic at a regular interval of 30 seconds. My servers come from different providers and all of them behaving this way are from the same provider so I tend to exclude my own software running on them. I contacted them explaining the pauses I'm seeing but they denied anything on their part, claiming it must be my software.
Atached, in the image, you can see the "blackouts" that run regularly. You can also see a big drop in traffic and that's where I stopped my software to see if the pauses still run, which they did.
I also did a curl test to see what is going on when that blackout hits by running curl --limit-rate 1M -o /dev/null https://speed.hetzner.de/1GB.bin. The feeling was that curl just pauses alltogether (during that 1s pause) and I can't describe the whole thing in any other way but like a mini, full system, freeze.
htop shows no new software running on those pauses, no high cpu usage to indicate any suspicious activity...nothing.
uname -a: Linux 5.10.0-16-amd64 #1 SMP Debian 5.10.127-1 (2022-06-30) x86_64 GNU/Linux
crontab -e shows just a script checking raid health but that one runs at totally different intervals.
Any ideas what to check in order to trace this thing?
