I'm running a 40 thread / 125GB RAM server.
The server is based on CentOS 7.
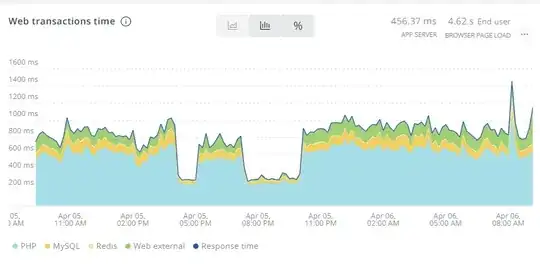
I have noticed that the server response time is higher when the server is idle:
You can see on the screenshot here that the server response between 4pm and 10PM was lower than during other times.
I looked at the logs and GoogleBot was hitting us at 4 requests / second at that moment which loaded up the server. Most of the requests from GoogleBot were 302 redirects (large ecommerce catalog with daily changes in live products).
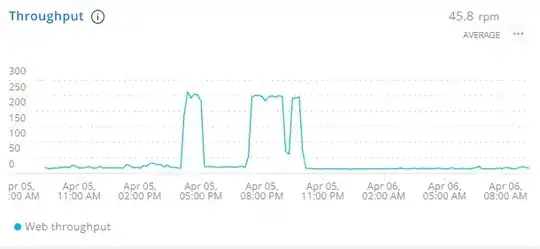
Here you can see the throughput of the server - during the times when the server was busy, that's when the response times were low.
How can I debug this?
What's causing this?
Could 302 redirects be cheaper than the 200 responses which skewed the data?
Could cache (Redis / Opcache / APCu) be evacuating too early which causes recreation of cache during idle time?
We're currently running: Apache 2.4 Nginx Proxy MySQL Redis Opcache APCu Elasticsearch
UPDATE:
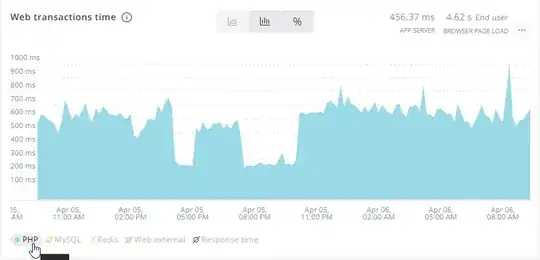
Looking at the separated processes PHP is taking up the most time:
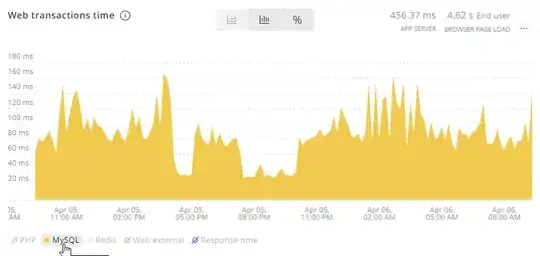
MySQL somewhat is correlating to PHP, but not fully:


