I am trying to integrate azure kubernetes container insights with grafana dashboard.
The plugin for that
For that, I have installed grafana on an azure cloud ubuntu 20 machine following the steps in this link
Allowed 3000 port in azure network security rules and able to access grafana portal using public ip of the VM with 3000 port.
Logged in with admin and password also admin and changed it later after login. Found the details in getting started guide
Installed azure monitor plugin with below command on the ubuntu machine and restarted the server and able to see the plugin there.
grafana-cli plugins install grafana-azure-monitor-datasource
By following the steps in link, I am able to register a new application and create a secret to it in azure and used that service principal and provided permissions(contributor role) to the default workspace of container insights linked to azure kubernetes cluster, which I want to monitor.
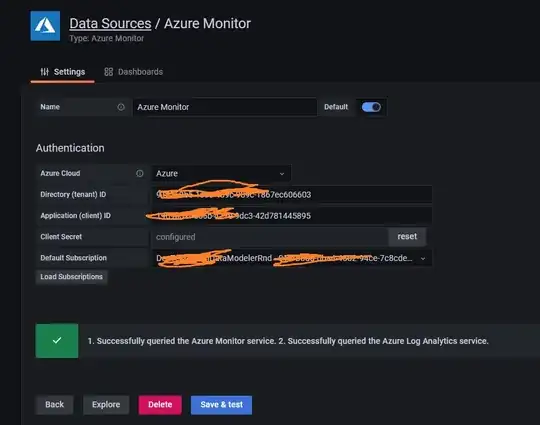
Then, when I provided those details in the grafana azure monitor data source.But the details configuration page is different when compared to the one in link.
But still clicked on save and test and got message.
Above screen is different from 7,8 steps in this link
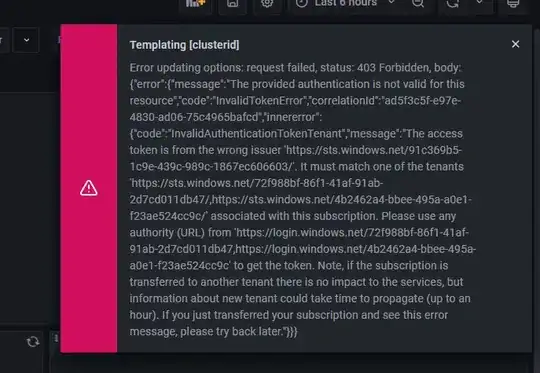
I tried to import dashboard 10956 as in step 10 on above link and got below error there.
Please suggest how to fix this

