Setting up an experimental lab cluster, the write speed for data received via 10G fiber connection is 10% of the local write speeds.
Testing transfer speed between two identical machines; iperf3 shows good memory to memory speed of 9.43Gbits/s. And speed for disk(read) to memory transfers of (9.35Gbit/s):
test@rbox1:~$ iperf3 -s -B 10.0.0.21

test@rbox3:~$ iperf3 -c 10.0.0.21 -F /mnt/k8s/test.3g
Connecting to host 10.0.0.21, port 5201
        Sent 9.00 GByte / 9.00 GByte (100%) of /mnt/k8s/test.3g
[  5]   0.00-8.26   sec  9.00 GBytes  9.35 Gbits/sec
But sending data over 10G and writing to disk on the other machine is an order of magnitude slower:
test@rbox1:~$ iperf3 -s 10.0.0.21 -F /tmp/foo -B 10.0.0.21

test@rbox3:~$ iperf3 -c 10.0.0.21
Connecting to host 10.0.0.21, port 5201
[  5] local 10.0.0.23 port 39970 connected to 10.0.0.21 port 5201
[ ID] Interval           Transfer     Bitrate         Retr  Cwnd
[  5]   0.00-1.00   sec   103 MBytes   864 Mbits/sec    0    428 KBytes
[  5]   1.00-2.00   sec   100 MBytes   842 Mbits/sec    0    428 KBytes
[  5]   2.00-3.00   sec  98.6 MBytes   827 Mbits/sec    0    428 KBytes
[  5]   3.00-4.00   sec  99.3 MBytes   833 Mbits/sec    0    428 KBytes
[  5]   4.00-5.00   sec  91.5 MBytes   768 Mbits/sec    0    428 KBytes
[  5]   5.00-6.00   sec  94.4 MBytes   792 Mbits/sec    0    428 KBytes
[  5]   6.00-7.00   sec  98.1 MBytes   823 Mbits/sec    0    428 KBytes
[  5]   7.00-8.00   sec  91.2 MBytes   765 Mbits/sec    0    428 KBytes
[  5]   8.00-9.00   sec  91.0 MBytes   764 Mbits/sec    0    428 KBytes
[  5]   9.00-10.00  sec  91.5 MBytes   767 Mbits/sec    0    428 KBytes
- - - - - - - - - - - - - - - - - - - - - - - - -
[ ID] Interval           Transfer     Bitrate         Retr
[  5]   0.00-10.00  sec   959 MBytes   804 Mbits/sec    0             sender
        Sent  959 MByte / 9.00 GByte (10%) of /mnt/k8s/test.3g
[  5]   0.00-10.00  sec   953 MBytes   799 Mbits/sec                  receiver
The NVME drive is capable of writing locally much much faster (detailed dd and fio measurements are below) - for single process and 4k/8k/10m chunks: fio random write speeds of 330/500/1300 MB/s
I am trying to achieve write speeds close to the actual local write speeds for the NVME drive (so yes, good to spell this assumption out -- I'm expecting to be able to reach very similar speeds writing to a single NVME drive over the network; but I can't even get 20% of it).
At this point I'm completely stomped, not seeing what else to try -- other than a different kernel/OS -- any pointers, corrections and help would be much appreciated.
And here some measurements/info/results:
What I tried so far:
jumbo frames (MTU 9000) on both machines and verified they worked (with
ping -mping -M do -s 8972)eliminated interference of network switch, I connected the two machines directly via 2m Dumplex OM3 Multimode fiber cable (the cable and tranceivers are identical on all machines) and I'm binding iperf3 server/client to these interfaces. Results are the same (slow).
disconnected all other ethernet/fiber cables for duration of the tests (to eliminate routing problems) - no change.
updated firmware of the motherboard and the Fiber NIC (again, no change). I have not updated the NVME firmware - seems to be the latest already.
even tried moving the 10G card from PCIE slot 1 to the next available slot; wondering if the NVME and 10G NIC were sharing and maxing physical hub lanes bandwidth (again, no measurable change).
Discovered some 'interesting' behaviour:
- increasing number of parallel clients increases bandwith utilization; with 1 client, the target machine is writing 900Mbits/sec; with 4 clients 1.26 Gbits/sec (more parallel clients beyond 4 have detrimental impact)
- testing write on a more powerful machine with AMD Ryzen 5 3600X and 64G RAM (identical NVME drive + 10G NIC) -- 1 client can reach up to 1.53Gbit/sec, 4 clients 2.15Gbits/sec (and 8 clients 2.13Gbit/sec). The traffic in this case flows through Mikrotik CS309 switch and MTU is 1500; the more powerful machine seems to receive/write faster
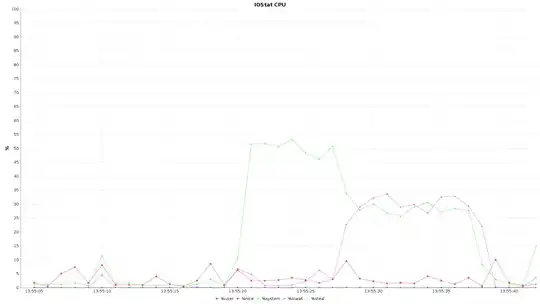
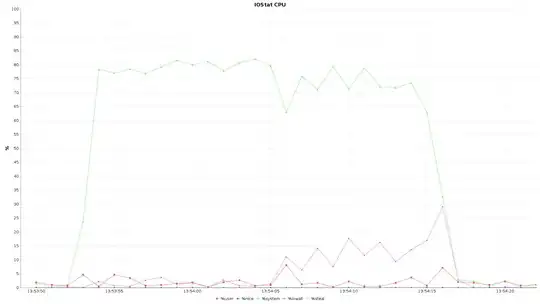
- there is no noticeable load during tests -- this applies to both small and the larger machine; it is 26% for 2 cores maybe
Edit 06/07:
Following @shodanshok comments, mounted remote machine over NFS; here are results:
nfs exports: /mnt/nfs *(rw,no_subtree_check,async,insecure,no_root_squash,fsid=0)
cat /etc/mtab | grep nfs 10.0.0.21:/mnt/nfs /mnt/nfs1 nfs rw,relatime,vers=3,rsize=1048576,wsize=1048576,namlen=255,hard,proto=tcp,timeo=600,retrans=2,sec=sys,mountaddr=10.0.0.21,mountvers=3,mountport=52335,mountproto=udp,local_lock=none,addr=10.0.0.21 0 0
fio --name=random-write --ioengine=libaio --rw=randwrite --bs=$SIZE --numjobs=1 --iodepth=1 --runtime=30 --end_fsync=1 --size=3g
dd if=/dev/zero of=/mnt/nfs1/test bs=$SIZE count=$(3*1024/$SIZE)
            | fio (bs=4k)    | fio (bs=8k)    | fio (bs=1M)   | dd (bs=4k)    | dd (bs=1M)
nfs (udp)   |  153           |    210        |   984            |   907        |962
nfs (tcp)   |    157          |    205        |    947           |   946        |916
All those measurements are MB/s I'm satisfied that 1M blocks reach very close to the theoretical speed limit of the 10G connection.
Looks like iperf3 -F ... is not the way to test network write speeds; but I'll try to get iperf3 devs take on it as well.
Details of the setup:
Each machine has AMD Ryzen 3 3200G with 8GB RAM, MPG X570 GAMING PLUS (MS-7C37) motherboard. 1x 1TB NVME drive (consumer grade WD Blue SN550 NVMe SSD WDS100T2B0C) in the M.2 slot closest to the CPU. And one SolarFlare S7120 10G Fiber card in the PCIe slot.
NVME disk info:
test@rbox1:~$ sudo nvme list
Node             SN                   Model                                    Namespace Usage                      Format           FW Rev
---------------- -------------------- ---------------------------------------- --------- -------------------------- ---------------- --------
/dev/nvme0n1     21062Y803544         WDC WDS100T2B0C-00PXH0                   1           1.00  TB /   1.00  TB    512   B +  0 B   211210WD
NVME disk write speed (4k/8k/10M)
test@rbox1:~$ dd if=/dev/zero of=/tmp/temp.bin bs=4k count=1000
1000+0 records in
1000+0 records out
4096000 bytes (4.1 MB, 3.9 MiB) copied, 0.00599554 s, 683 MB/s


test@rbox1:~$ dd if=/dev/zero of=/tmp/temp.bin bs=8k count=1000
1000+0 records in
1000+0 records out
8192000 bytes (8.2 MB, 7.8 MiB) copied, 0.00616639 s, 1.3 GB/s


test@rbox1:~$ dd if=/dev/zero of=/tmp/temp.bin bs=10M count=1000
1000+0 records in
1000+0 records out
10485760000 bytes (10 GB, 9.8 GiB) copied, 7.00594 s, 1.5 GB/s
Testing random write speed with fio-3.16:
test@rbox1:~$ fio --name=random-write --ioengine=posixaio --rw=randwrite --bs=4k --numjobs=1 --iodepth=1 --runtime=30 --time_based --end_fsync=1
random-write: (g=0): rw=randwrite, bs=(R) 4096B-4096B, (W) 4096B-4096B, (T) 4096B-4096B, ioengine=posixaio, iodepth=1

Run status group 0 (all jobs):
  WRITE: bw=313MiB/s (328MB/s), 313MiB/s-313MiB/s (328MB/s-328MB/s), io=9447MiB (9906MB), run=30174-30174msec

Disk stats (read/write):
    dm-0: ios=2/969519, merge=0/0, ticks=0/797424, in_queue=797424, util=21.42%, aggrios=2/973290, aggrmerge=0/557, aggrticks=0/803892, aggrin_queue=803987, aggrutil=21.54%
  nvme0n1: ios=2/973290, merge=0/557, ticks=0/803892, in_queue=803987, util=21.54%


test@rbox1:~$ fio --name=random-write --ioengine=posixaio --rw=randwrite --bs=8k --numjobs=1 --iodepth=1 --runtime=30 --time_based --end_fsync=1
random-write: (g=0): rw=randwrite, bs=(R) 8192B-8192B, (W) 8192B-8192B, (T) 8192B-8192B, ioengine=posixaio, iodepth=1

Run status group 0 (all jobs):
  WRITE: bw=491MiB/s (515MB/s), 491MiB/s-491MiB/s (515MB/s-515MB/s), io=14.5GiB (15.6GB), run=30213-30213msec

Disk stats (read/write):
    dm-0: ios=1/662888, merge=0/0, ticks=0/1523644, in_queue=1523644, util=29.93%, aggrios=1/669483, aggrmerge=0/600, aggrticks=0/1556439, aggrin_queue=1556482, aggrutil=30.10%
  nvme0n1: ios=1/669483, merge=0/600, ticks=0/1556439, in_queue=1556482, util=30.10%


test@rbox1:~$ fio --name=random-write --ioengine=posixaio --rw=randwrite --bs=10m --numjobs=1 --iodepth=1 --runtime=30 --time_based --end_fsync=1
random-write: (g=0): rw=randwrite, bs=(R) 10.0MiB-10.0MiB, (W) 10.0MiB-10.0MiB, (T) 10.0MiB-10.0MiB, ioengine=posixaio, iodepth=1

Run status group 0 (all jobs):
  WRITE: bw=1250MiB/s (1310MB/s), 1250MiB/s-1250MiB/s (1310MB/s-1310MB/s), io=36.9GiB (39.6GB), run=30207-30207msec

Disk stats (read/write):
    dm-0: ios=9/14503, merge=0/0, ticks=0/540252, in_queue=540252, util=68.96%, aggrios=9/81551, aggrmerge=0/610, aggrticks=5/3420226, aggrin_queue=3420279, aggrutil=69.16%
  nvme0n1: ios=9/81551, merge=0/610, ticks=5/3420226, in_queue=3420279, util=69.16%
Kernel:
test@rbox1:~$ uname -a
Linux rbox1 5.8.0-55-generic #62-Ubuntu SMP Tue Jun 1 08:21:18 UTC 2021 x86_64 x86_64 x86_64 GNU/Linux
Fiber NIC:
test@rbox1:~$ sudo sfupdate
Solarflare firmware update utility [v8.2.2]
Copyright 2002-2020 Xilinx, Inc.
Loading firmware images from /usr/share/sfutils/sfupdate_images

enp35s0f0np0 - MAC: 00-0F-53-3B-7D-D0
    Firmware version:   v8.0.1
    Controller type:    Solarflare SFC9100 family
    Controller version: v6.2.7.1001
    Boot ROM version:   v5.2.2.1006

The Boot ROM firmware is up to date
The controller firmware is up to date
Fiber NIC's initialized and MTU set:
test@rbox1:~$ sudo dmesg | grep sf
[    0.210521] ACPI: 10 ACPI AML tables successfully acquired and loaded
[    1.822946] sfc 0000:23:00.0 (unnamed net_device) (uninitialized): Solarflare NIC detected
[    1.824954] sfc 0000:23:00.0 (unnamed net_device) (uninitialized): Part Number : SFN7x22F
[    1.825434] sfc 0000:23:00.0 (unnamed net_device) (uninitialized): no PTP support
[    1.958282] sfc 0000:23:00.1 (unnamed net_device) (uninitialized): Solarflare NIC detected
[    2.015966] sfc 0000:23:00.1 (unnamed net_device) (uninitialized): Part Number : SFN7x22F
[    2.031379] sfc 0000:23:00.1 (unnamed net_device) (uninitialized): no PTP support
[    2.112729] sfc 0000:23:00.0 enp35s0f0np0: renamed from eth0
[    2.220517] sfc 0000:23:00.1 enp35s0f1np1: renamed from eth1
[    3.494367] [drm] VCN decode and encode initialized successfully(under DPG Mode).
[ 1748.247082] sfc 0000:23:00.0 enp35s0f0np0: link up at 10000Mbps full-duplex (MTU 1500)
[ 1809.625958] sfc 0000:23:00.1 enp35s0f1np1: link up at 10000Mbps full-duplex (MTU 9000)
Motherboard ID:
# dmidecode 3.2
Getting SMBIOS data from sysfs.
SMBIOS 2.8 present.

Handle 0x0001, DMI type 1, 27 bytes
System Information
    Manufacturer: Micro-Star International Co., Ltd.
    Product Name: MS-7C37
    Version: 2.0
Additional HW info (mostly to list physical connections - bridges)
test@rbox1:~$ hwinfo --short
cpu:
                       AMD Ryzen 3 3200G with Radeon Vega Graphics, 1500 MHz
                       AMD Ryzen 3 3200G with Radeon Vega Graphics, 1775 MHz
                       AMD Ryzen 3 3200G with Radeon Vega Graphics, 1266 MHz
                       AMD Ryzen 3 3200G with Radeon Vega Graphics, 2505 MHz
storage:
                       ASMedia ASM1062 Serial ATA Controller
                       Sandisk Non-Volatile memory controller
                       AMD FCH SATA Controller [AHCI mode]
                       AMD FCH SATA Controller [AHCI mode]
network:
  enp35s0f1np1         Solarflare SFN7x22F-R3 Flareon Ultra 7000 Series 10G Adapter
  enp35s0f0np0         Solarflare SFN7x22F-R3 Flareon Ultra 7000 Series 10G Adapter
  enp39s0              Realtek RTL8111/8168/8411 PCI Express Gigabit Ethernet Controller
network interface:
  br-0d1e233aeb68      Ethernet network interface
  docker0              Ethernet network interface
  vxlan.calico         Ethernet network interface
  veth0ef4ac4          Ethernet network interface
  enp35s0f0np0         Ethernet network interface
  enp35s0f1np1         Ethernet network interface
  lo                   Loopback network interface
  enp39s0              Ethernet network interface
disk:
  /dev/nvme0n1         Sandisk Disk
  /dev/sda             WDC WD5000AAKS-4
partition:
  /dev/nvme0n1p1       Partition
  /dev/nvme0n1p2       Partition
  /dev/nvme0n1p3       Partition
  /dev/sda1            Partition
bridge:
                       AMD Matisse Switch Upstream
                       AMD Family 17h (Models 00h-1fh) PCIe Dummy Host Bridge
                       AMD Raven/Raven2 Device 24: Function 3
                       AMD Raven/Raven2 PCIe GPP Bridge [6:0]
                       AMD Matisse PCIe GPP Bridge
                       AMD Raven/Raven2 Device 24: Function 1
                       AMD Family 17h (Models 00h-1fh) PCIe Dummy Host Bridge
                       AMD FCH LPC Bridge
                       AMD Matisse PCIe GPP Bridge
                       AMD Matisse PCIe GPP Bridge
                       AMD Raven/Raven2 Device 24: Function 6
                       AMD Matisse PCIe GPP Bridge
                       AMD Raven/Raven2 Root Complex
                       AMD Raven/Raven2 Internal PCIe GPP Bridge 0 to Bus A
                       AMD Raven/Raven2 Device 24: Function 4
                       AMD Matisse PCIe GPP Bridge
                       AMD Raven/Raven2 Device 24: Function 2
                       AMD Matisse PCIe GPP Bridge
                       AMD Raven/Raven2 Device 24: Function 0
                       AMD Raven/Raven2 Device 24: Function 7
                       AMD Raven/Raven2 PCIe GPP Bridge [6:0]
                       AMD Raven/Raven2 Device 24: Function 5


