5

Been running a couple of fio tests on a new server with the following setup:

  • 1x Samsung PM981a 512GB M.2 NVMe drive.
    • Proxmox installed with ZFS on root.
    • 1x VM with 30GB space created and Debian 10 installed.
  • 6x Intel P4510 2TB U.2 NVMe drives connected to 6x dedicated PCIe 4.0 x4 lanes with OCuLink.
    • Directly attached to the single VM.
    • Configured as RAID10 in the VM (3x mirrors striped).
  • Motherboard / CPU / memory: ASUS KRPA-U16 / EPYC 7302P / 8x32GB DDR4-3200

The disks are rated up to 3,200 MB/s sequential reads. From a theoretical point of view that should give a max bandwidth of 19.2 GB/s.

Running fio with numjobs=1 on the ZFS RAID I'm getting results in the range ~2,000 - 3,000 MB/s (the disks are capable of the full 3,200 MB/s when testing without ZFS or any other overhead, for example, while running Crystal Disk Mark in Windows installed directly on one of the disks):

fio --name=Test --size=100G --bs=1M --iodepth=8 --numjobs=1 --rw=read --filename=fio.test
=>
Run status group 0 (all jobs):
   READ: bw=2939MiB/s (3082MB/s), 2939MiB/s-2939MiB/s (3082MB/s-3082MB/s), io=100GiB (107GB), run=34840-34840msec

Seems reasonable everything considered. Might also be CPU limited as one of the cores will be sitting on 100% load (with some of that spent on ZFS processes).

When I increase numjobs to 8-10 things get a bit weird though:

fio --name=Test --size=100G --bs=1M --iodepth=8 --numjobs=10 --rw=read --filename=fio.test
=>
Run status group 0 (all jobs):
   READ: bw=35.5GiB/s (38.1GB/s), 3631MiB/s-3631MiB/s (3808MB/s-3808MB/s), io=1000GiB (1074GB), run=28198-28199msec

38.1 GB/s - well above the theoretical maximum bandwidth.

What exactly is the explanation here?

Additions for comments:

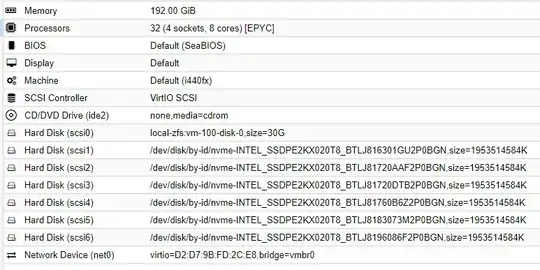
VM configuration:

enter image description here

iotop during test:

enter image description here

Woodgnome
  • 193
  • 6
  • I'm not sure what to make of these results, yet interesting. Could you specify your vm? – digijay May 27 '20 at 22:36
  • 1
    Can you verify (using iotop or something) that you're actually processing data during the second test? I'd wager you aren't which would explain your high numbers. – Bert May 27 '20 at 23:54
  • 1
    @digijay added screenshot from Proxmox Hardware tab. @Bert added screenshot from `iotop` - seems to agree with the test results. – Woodgnome May 28 '20 at 07:46
  • Nice setup you got there. This might be only slightly related, but did you already have a look at this? https://forum.proxmox.com/threads/zfs-performance-regression-with-proxmox.51010/ - unfortunately the question has not yet been resolved – digijay May 28 '20 at 08:01
  • 1
    Sort of - we (me and the system administrator) tested performance for directly attached disks vs. Proxmox controlling the ZFS and then attaching the Proxmox storage to the VM - results are significantly worse in that case (which makes sense, because you're adding a lot of overhead). – Woodgnome May 28 '20 at 08:13

2 Answers2

3

The first fio (the one with --numjobs=1) sequentially executes any read operation, having no benefit from your stripe config apart for quick read-ahead/prefetch: iodepth only applies to async reads done via libaio engine, which in turn requires true support for O_DIRECT (which ZFS lacks). You can try to increase the prefetch window up from the default 8M to something as 64M (echo ‭67108864‬ > /sys/module/zfs/parameters/zfetch_max_distance). Of course your mileage may vary, so be sure to check this does not impair other workloads.

The second fio (the one with --numjobs=8) is probably skewed by ARC caching. To be sure, simply open another terminal running dstat -d -f: you will see the true transfer speed of each disk, and it will surely be in-line with their theoretical max transfer rate. You can also retry the fio test with a freshly booted machine (so with an empty ARC) to see if things change.

shodanshok
  • 44,038
  • 6
  • 98
  • 162
  • I was also thinking there might be some cache in play (DRAM or ARC) - server reboot doesn't do anything though, but running `fio` with different files for each job nets a much more modest result of ~8 GB/s. `dstat` also shows ~400 MB/s reads per disk with the single file job and ~1,300 MB/s for the multi-file job. – Woodgnome May 28 '20 at 08:59
2

For sequential I/O tests with multiple jobs, each job (ie, thread) has a thread-specific file pointer (block address for raw devices) that starts at zero by default and advances independently of the other threads. That means fio will issue read requests to the filesystem with duplicate/overlapping file pointers/block addresses across the jobs. You can see this in action if you use the write_iolog option. The overlapping requests will skew the benchmark result since they'll likely be satisfied by a read cache, either in the filesystem (when testing to a file) or by the device (when running on a raw volume).

What you want instead is a single job and then modify the iodepth parameter exclusively to control the I/O queue depth. This specifies the number of concurrent I/Os each job is allowed to have active.

The only downside is total achievable IOPs may become single-core/thread limited. This shouldn't be a problem for large-block sequential workloads since they're not IOPs bound. For random I/O you definitely want to use multiple jobs, especially on NVMe drives that can handle upwards of a million IOPs.

Horshack
  • 21
  • 2