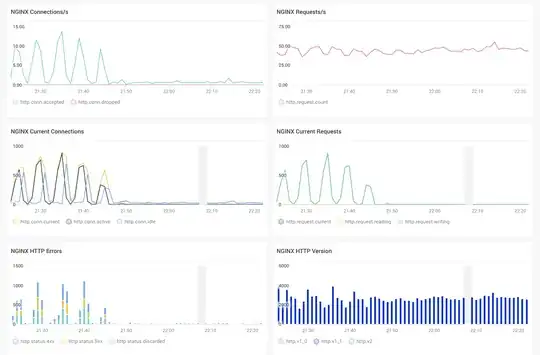
I have an application with about 200k users and am running a NGINX + Gunicorn(Python) server behind an AWS EC2 loadbalancer.
I don't understand how my requests is always 4k/minute but only sometimes I get half of traffic being timeout issues. Most of the time all requests are fine, but sometimes it starts to lock up then almost all requests get timeouts.
I noticed this pattern of the # of current connections has a wave and fluctuates from 1000s to 0. Is NGINX bundling requests somehow? How can I differentiate request_time to figure out whether it's NGINX not being configured properly, or my Python server just getting extra slow endpoints being called too often.
I've attached a screenshot of one of the servers in my NGINX Amplify dashboard.
Any ideas of parts of NGINX logs or Amplify that I can investigate to determine whether this is an NGINX configuration issue, or if the hosted Python process is getting locked up? Thank you!
