In biometrics, most people talk about False Acceptance Rate (FAR) (i.e. what is the chance that two samples of different individuals match).
DNA and iris biometrics, for example, have a very low FAR. However, I found that it is very difficult to find numbers about the False Rejection Rate (FRR) (i.e. what is the chance that two samples of the same individual do not match).
Now, specifically about the iris biometric, the Hamming distance (HD) is often used to distinguish between iris samples of the same person and iris samples of a different person. One can look at the HD as a probability measure that the phase sequences for two iris samples might disagree in a certain percentage (the HD) of their bits. It has been researched that setting a HD of 0.27 will maintain a false match probability of 10^-6 for a database of 1 million different iris patterns (John Daugman).
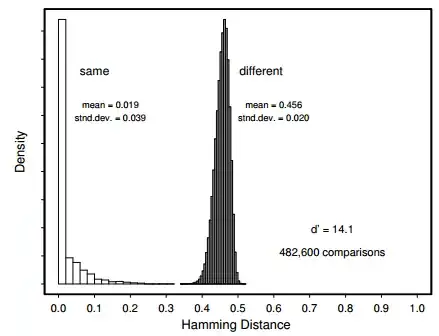
It is a good thing that the false match probability, or the false acceptance rate, is extremely low. What I'm wondering is, how does one deduct the other rate, the false rejection rate, from the HD (if possible at all). So, i've taken a simplified figure of the HD (see below, source), and as you can see, a perfect distinction between the HD of irises of the same person (left) and the HD of irises of different persons (right) exist in this figure. Let's say this perfect distinction happens at a HD of 0.33. Can I (in this figure, when setting a HD of 0.33) assume that both the false acceptance rate and the false rejection rate are 0?
If not, can anyone point me to studies/research where the FRR of irisscans has been researched? For example in this paper, the false rejection rate is investigated, but it is unclear to me how it relates to the Hamming distance.
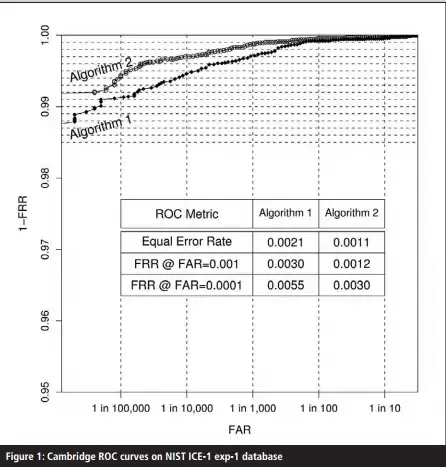
Ultimately, I am looking to complete the following table. The FAR is already there, but I also need to know the FRR (table based on this paper):
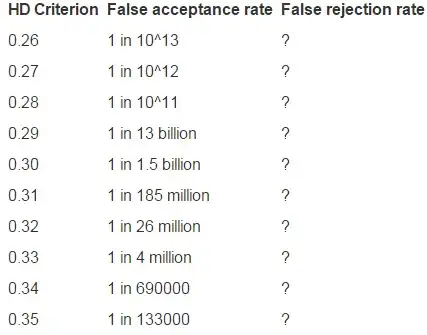
NOTE: the 'Handbook of Biometrics' of Anil K. Jain et. al. provides a more detailed version of this table.