How is the accuracy of a biometric security system (its ability to minimize false acceptance rate and false rejection rate) determined?
Asked
Active
Viewed 9,273 times
2
-
I have removed the 2nd question you included - it is far too broad to be answerable here. – Rory Alsop May 09 '14 at 11:23
3 Answers
3
Well, I am not sure if this what you are looking for. In general, the performance of any biometric system (e.g fingerprint, voice, facial recognition, etc) is described using several metrics.
FAR or False Acceptance rate is the probability that the system incorrectly authorizes a non-authorized person, due to incorrectly matching the biometric input with a template. The FAR is normally expressed as a percentage, following the FAR definition this is the percentage of invalid inputs which are incorrectly accepted.
FRR or False Rejection Rate is the probability that the system incorrectly rejects access to an authorized person, due to failing to match the biometric input with a template. The FRR is normally expressed as a percentage, following the FRR definition this is the percentage of valid inputs which are incorrectly rejected.
CER or Crossover Error Rate is the rate where both accept and reject error rates are equal.
FER The Failure to Enroll Rate (FER) is the percentage of the population which fails to complete enrollment.
EXAMPLE:
let us assume we have a fingerprint biometric system. We also, have 100 users. During the enrollment stage 5 users where not able to enroll (e.g we can not establish a fingerprint signature/template for them). This means the system has a Failure to Enroll Rate (FER) = 5%. This means only 95 users can use the system.
Then, during the testing out of the 95 users, 10 users were rejected when the system match their fingerprint against their enrollment fingerprint template. This means the FRR =10.52%.
Also, 3 users out of the 95 users were accepted by the system when the system match their fingerprint against other users fingerprint template. This means the FAR = 3.15%
The lower FAR and FRR , the better the system
Ubaidah
- 1,054
- 6
- 11
0
A lot of articles on the Web claim that the EER is where the two curves intersect - not true - it is where the area under the curves is equal. Lab data may produce nice smooth symmetrical curves where the EER is at the intersection, but real world data produces asymmetrical curves which cannot be predicted from lab data.
-
This doesn't answer the question. This is a comment on another's answer. – schroeder Sep 21 '15 at 03:29
-
Also, you will need to cite a source to show that your assertion is correct. – schroeder Sep 21 '15 at 03:30
0
The accuracy of biometric systems is usually expressed by its equal error rate (EER). The lower this number is, the better the system performs.
When discussing biometric systems, two primary metrics are particularly interesting with regards to how well the system works (the "accuracy" you are referring to): False acceptance rate (FAR) and false rejection rate (FFR). FAR occurs when we accept a user whom we should have rejected (a false positive), while FFR occurs when we reject a user whom we should have accepted (a false negative).
If we plot FAR and FFR on a graph, like on the one below, the EER is the point where the two curves intersect.
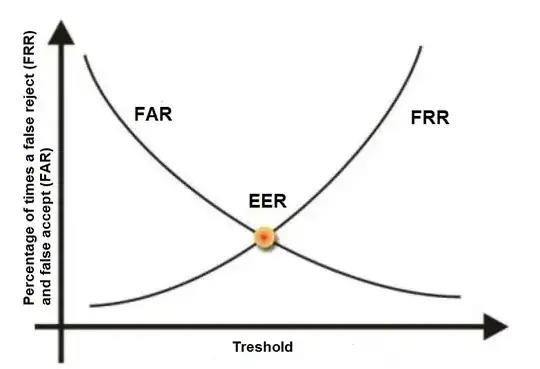
To lower the EER - increasing the system's accuracy - one must improve the system's hardware and its software (the algorithm).
You can consult Biometric principles on Biometria's web site for more information.
Steven Volckaert
- 1,193
- 8
- 15