Climate of New York City
The climate of New York City features a humid subtropical climate (Cfa), with parts of the city transitioning into a humid continental climate. (Dfa)[1] This gives the city cold, snowy winters and hot, humid summers and plentiful rainfall all year round. Meteorological records have been kept at Central Park since 1821, although the station was relocated to a different part of the park on January 1, 1920.[2] There are also other weather stations in the area including one at LaGuardia Airport, beginning in 1940, and at JFK Airport, beginning in 1948. However, due to Central Park's long records and central location, it is often considered the main station for the city. Hence, all records unless otherwise stated will be for this station.
| New York | ||||||||||||||||||||||||||||||||||||||||||||||||||||||||||||
|---|---|---|---|---|---|---|---|---|---|---|---|---|---|---|---|---|---|---|---|---|---|---|---|---|---|---|---|---|---|---|---|---|---|---|---|---|---|---|---|---|---|---|---|---|---|---|---|---|---|---|---|---|---|---|---|---|---|---|---|---|
| Climate chart (explanation) | ||||||||||||||||||||||||||||||||||||||||||||||||||||||||||||
| ||||||||||||||||||||||||||||||||||||||||||||||||||||||||||||
| ||||||||||||||||||||||||||||||||||||||||||||||||||||||||||||

The highest temperature ever observed in New York City is 106 °F (41 °C) on July 9, 1936 and the lowest is −15 °F (−26 °C) on February 9, 1934. The lowest daily maximum is 2 °F (−17 °C) on 30 December 1917 at Central Park. The highest daily minimum at Central Park is 84 °F (29 °C) on 4 dates, including: July 7, 1908, August 14, 1908, July 15, 1995 and July 22, 2011 [3] However, LaGuardia reported 107 °F (42 °C) on July 7, 1966.
The city can be prone to extremes. Snowfall is a rare occurrence in the city, on average occurring on only 12 days per year, and it is infrequently heavy, but can be on occasion. Thunderstorms are also an occasional, on average occurring on 11 days per year.[4] The city can also be prone to strong winds, being a coastal location it is exposed to the Atlantic. This can be especially pronounced during the autumn and winter months, with a gust of 78 miles per hour (126 km/h) being reported on December 2, 1974.[5]
Classifications

As a result of the city sitting in transitional zones, its climate can be characterised by more than one classification.
| Climatic scheme | Initials | Description |
|---|---|---|
| Köppen system[6] | Cfa | humid subtropical climate |
| Trewartha system[7] | Do | Temperate oceanic climate |
| Alisov system[8] | N/A | Temperate climate[lower-alpha 1] |
| Strahler system[9] | N/A | Moist continental climate |
| Thornthwaite system[10] | Moist subhumid | |
| Neef system[11] | N/A | Temperate climate |
In the Holdridge life zones system, having a mean annual biotemperature above 53.6 °F (12 °C) and mean annual precipitation above 39.4 inches (1,000 mm), New York City features a warm temperate moist forest climate.[12]
Temperature
The city's regime of temperature features large seasonal swings, with 4 distinct seasons. However, due to its proximity to the Atlantic ocean, these swings are less significant than areas further inland. The Atlantic serves as a moderator of the temperature meaning the city is milder than areas inland during the winter and cooler during the summer. Although, being on the east coast, this effect is less pronounced. All extremes are for the Central Park station.
Averages
In an average year, the temperature will usually be between 7 °F (−14 °C) and 97 °F (36 °C) with temperatures exceeding these values being uncommon. Temperatures above 100 °F (38 °C) and below 0 °F (−18 °C) are very rare, with the last occurrences being July 18, 2012 and February 14, 2016, respectively. [13]
| Climate data for New York (Belvedere Castle, Central Park), 1981–2010 normals | |||||||||||||
|---|---|---|---|---|---|---|---|---|---|---|---|---|---|
| Month | Jan | Feb | Mar | Apr | May | Jun | Jul | Aug | Sep | Oct | Nov | Dec | Year |
| Mean maximum °F (°C) | 59.6 (15.3) |
60.7 (15.9) |
71.5 (21.9) |
83.0 (28.3) |
88.0 (31.1) |
92.3 (33.5) |
95.4 (35.2) |
93.7 (34.3) |
88.5 (31.4) |
78.8 (26.0) |
71.3 (21.8) |
62.2 (16.8) |
97.0 (36.1) |
| Average high °F (°C) | 38.3 (3.5) |
41.6 (5.3) |
49.7 (9.8) |
61.2 (16.2) |
70.8 (21.6) |
79.3 (26.3) |
84.1 (28.9) |
82.6 (28.1) |
75.2 (24.0) |
63.8 (17.7) |
53.8 (12.1) |
43.0 (6.1) |
62.0 (16.7) |
| Daily mean °F (°C) | 32.6 (0.3) |
35.3 (1.8) |
42.5 (5.8) |
53.0 (11.7) |
62.4 (16.9) |
71.5 (21.9) |
76.5 (24.7) |
75.2 (24.0) |
68.0 (20.0) |
56.9 (13.8) |
47.7 (8.7) |
37.5 (3.1) |
55.0 (12.8) |
| Average low °F (°C) | 26.9 (−2.8) |
28.9 (−1.7) |
35.2 (1.8) |
44.8 (7.1) |
54.0 (12.2) |
63.6 (17.6) |
68.8 (20.4) |
67.8 (19.9) |
60.8 (16.0) |
50.0 (10.0) |
41.6 (5.3) |
32.0 (0.0) |
48.0 (8.9) |
| Mean minimum °F (°C) | 9.2 (−12.7) |
12.8 (−10.7) |
18.5 (−7.5) |
32.3 (0.2) |
43.5 (6.4) |
52.9 (11.6) |
60.3 (15.7) |
58.8 (14.9) |
48.6 (9.2) |
38.0 (3.3) |
27.7 (−2.4) |
15.6 (−9.1) |
7.0 (−13.9) |
| Source: NOAA [14] | |||||||||||||
| Climate data for New York (Central Park), 1822–1871 normals | |||||||||||||
|---|---|---|---|---|---|---|---|---|---|---|---|---|---|
| Month | Jan | Feb | Mar | Apr | May | Jun | Jul | Aug | Sep | Oct | Nov | Dec | Year |
| Daily mean °F (°C) | 29.8 (−1.2) |
30.4 (−0.9) |
38.1 (3.4) |
48.7 (9.3) |
59.2 (15.1) |
69.3 (20.7) |
74.8 (23.8) |
73.2 (22.9) |
65.7 (18.7) |
54.5 (12.5) |
43.5 (6.4) |
33.3 (0.7) |
51.6 (10.9) |
| Source: [15] | |||||||||||||
Highest daily temperatures
|
Lowest daily temperatures
|
Daily record warm minima
|
Daily record cold maxima
|
Highest averages
|
Lowest averages
|
Precipitation
The city sees frequent, heavy rainfall which averages 49.9 in (1,267 mm) annually, with spring being the wettest season and February the driest month. Every single month in the cities recorded history has reported some rainfall, alerting the variability of the climate. Further highlighting the city's variability of weather is the record of only 36 consecutive days without precipitation, between October 10 and November 13, 1924. The city also sees snow, primarily in winter, but sometimes in the late autumn and early spring. Snowfall averages 25.8 in (65.5 cm) per year but is highly variably between winter seasons.[17] The most rainfall in 24 hours was 8.28 in (210.3 mm) on September 23, 1882 and the most snowfall was 27.3 in (69 cm) on January 23, 2016.[18]
Averages
Climate data for New York (Belvedere Castle, Central Park), 1981–2010 normals, | |||||||||||||
|---|---|---|---|---|---|---|---|---|---|---|---|---|---|
| Month | Jan | Feb | Mar | Apr | May | Jun | Jul | Aug | Sep | Oct | Nov | Dec | Year |
| Average precipitation inches (mm) | 3.65 (93) |
3.09 (78) |
4.36 (111) |
4.50 (114) |
4.19 (106) |
4.41 (112) |
4.60 (117) |
4.44 (113) |
4.28 (109) |
4.40 (112) |
4.02 (102) |
4.00 (102) |
49.94 (1,268) |
| Average snowfall inches (cm) | 7.0 (18) |
9.2 (23) |
3.9 (9.9) |
0.6 (1.5) |
0.0 (0.0) |
0.0 (0.0) |
0.0 (0.0) |
0.0 (0.0) |
0.0 (0.0) |
0.0 (0.0) |
0.3 (0.76) |
4.8 (12) |
25.8 (65.16) |
| Average precipitation days (≥ 0.01 in) | 10.4 | 9.2 | 10.9 | 11.5 | 11.1 | 11.2 | 10.4 | 9.5 | 8.7 | 8.9 | 9.6 | 10.6 | 122.0 |
| Average snowy days (≥ 0.1 in) | 4.0 | 2.8 | 1.8 | 0.3 | 0.0 | 0.0 | 0.0 | 0.0 | 0.0 | 0.0 | 0.2 | 2.3 | 11.4 |
| Source: NOAA [19] | |||||||||||||
Rainfall Extremes
Lowest
|
Highest
|
Snowfall
Highest
|
Lowest
|
Other phenomena
Sunshine, UV and daylight
The city generally experiences sunny conditions, with cloudy days occurring infrequently, although they are more common in the city than inland areas. As a result of New York City's latitude, 40°42′46″N 74°00′22″W, it is not subject to the extremes of daylight that places much farther north see.[21] However, it is far north enough for there to be a moderate change of possible daylight hours throughout the year.[22]
Climate data for New York (Belvedere Castle, Central Park) | |||||||||||||
|---|---|---|---|---|---|---|---|---|---|---|---|---|---|
| Month | Jan | Feb | Mar | Apr | May | Jun | Jul | Aug | Sep | Oct | Nov | Dec | Year |
| Mean monthly sunshine hours | 162.7 | 163.1 | 212.5 | 225.6 | 256.6 | 257.3 | 268.2 | 268.2 | 219.3 | 211.2 | 151.0 | 139.0 | 2,534.7 |
| Mean daily daylight hours | 9.7 | 10.7 | 12.0 | 13.0 | 14.5 | 15.1 | 14.7 | 13.7 | 12.4 | 11.1 | 9.9 | 9.3 | 12.2 |
| Percent possible sunshine | 54 | 55 | 57 | 57 | 57 | 57 | 59 | 63 | 59 | 61 | 51 | 48 | 57 |
| Average ultraviolet index | 2 | 3 | 4 | 6 | 7 | 8 | 8 | 8 | 6 | 4 | 2 | 1 | 5 |
| Source 1: NOAA (relative humidity and sun 1961–1990)[23] | |||||||||||||
| Source 2: Weather Atlas[22] | |||||||||||||
Wind
The wind is seldom strong in New York City but can occasionally be noticeable. This is especially true in the autumn and winter seasons when extratropical depressions often bring strong winds. The strongest gust in Central Park, of 78 miles per hour (126 km/h), occurred on December 2, 1974 however, a station at The Battery reported a gust of 113 miles per hour (182 km/h) on October 14, 1954. [24] However, tropical storms can sometimes affect the area, although they are infrequent and usually weak. Most recently Hurricane Sandy struck the city on October 29, 2012 causing billions of dollars in damage. It resulted in loss of power, severe flooding and many residents being displaced.[25]
Climate change
.jpg)
Being a coastal city, New York City is expected to experience significant affects from rising sea levels. Predictions that the sea level will rise by as much as 6 feet (1.8 m) by 2100 have prompted the city's mayor to invest $10 million dollars into keeping the city safe.[26] The city is also expected to become more susceptible to storm surges and flooding, meaning events like Hurricane Sandy's impacts will become more likely in the future.
Temperature
The temperature in New York City has generally increased steadily of the last 150 years and this trend is expected to continue due to anthropocentric warming. By 2080, it is predicted that the climate of the city will be similar to southern Kansas. The mean temperature has risen by 2.4 °F (1.3 °C) since the 1970s and this warming is expected to accelerate in the coming decades.[27][28]
Precipitation
Precipitation in the city has significantly increased since 2000, both rainfall and snowfall have risen, but snowfall has increased much more significantly. However, it is argued that such trends, being so recent, are impossible to predict whether such increases will continue or become steadier. [29]
Climactic data
Climate data for New York (Belvedere Castle, Central Park), 1981–2010 normals,[lower-alpha 2] extremes 1869–present[lower-alpha 3] | |||||||||||||
|---|---|---|---|---|---|---|---|---|---|---|---|---|---|
| Month | Jan | Feb | Mar | Apr | May | Jun | Jul | Aug | Sep | Oct | Nov | Dec | Year |
| Record high °F (°C) | 72 (22) |
78 (26) |
86 (30) |
96 (36) |
99 (37) |
101 (38) |
106 (41) |
104 (40) |
102 (39) |
94 (34) |
84 (29) |
75 (24) |
106 (41) |
| Mean maximum °F (°C) | 59.6 (15.3) |
60.7 (15.9) |
71.5 (21.9) |
83.0 (28.3) |
88.0 (31.1) |
92.3 (33.5) |
95.4 (35.2) |
93.7 (34.3) |
88.5 (31.4) |
78.8 (26.0) |
71.3 (21.8) |
62.2 (16.8) |
97.0 (36.1) |
| Average high °F (°C) | 38.3 (3.5) |
41.6 (5.3) |
49.7 (9.8) |
61.2 (16.2) |
70.8 (21.6) |
79.3 (26.3) |
84.1 (28.9) |
82.6 (28.1) |
75.2 (24.0) |
63.8 (17.7) |
53.8 (12.1) |
43.0 (6.1) |
62.0 (16.7) |
| Average low °F (°C) | 26.9 (−2.8) |
28.9 (−1.7) |
35.2 (1.8) |
44.8 (7.1) |
54.0 (12.2) |
63.6 (17.6) |
68.8 (20.4) |
67.8 (19.9) |
60.8 (16.0) |
50.0 (10.0) |
41.6 (5.3) |
32.0 (0.0) |
48.0 (8.9) |
| Mean minimum °F (°C) | 9.2 (−12.7) |
12.8 (−10.7) |
18.5 (−7.5) |
32.3 (0.2) |
43.5 (6.4) |
52.9 (11.6) |
60.3 (15.7) |
58.8 (14.9) |
48.6 (9.2) |
38.0 (3.3) |
27.7 (−2.4) |
15.6 (−9.1) |
7.0 (−13.9) |
| Record low °F (°C) | −6 (−21) |
−15 (−26) |
3 (−16) |
12 (−11) |
32 (0) |
44 (7) |
52 (11) |
50 (10) |
39 (4) |
28 (−2) |
5 (−15) |
−13 (−25) |
−15 (−26) |
| Average precipitation inches (mm) | 3.65 (93) |
3.09 (78) |
4.36 (111) |
4.50 (114) |
4.19 (106) |
4.41 (112) |
4.60 (117) |
4.44 (113) |
4.28 (109) |
4.40 (112) |
4.02 (102) |
4.00 (102) |
49.94 (1,268) |
| Average snowfall inches (cm) | 7.0 (18) |
9.2 (23) |
3.9 (9.9) |
0.6 (1.5) |
0 (0) |
0 (0) |
0 (0) |
0 (0) |
0 (0) |
0 (0) |
0.3 (0.76) |
4.8 (12) |
25.8 (66) |
| Average precipitation days (≥ 0.01 in) | 10.4 | 9.2 | 10.9 | 11.5 | 11.1 | 11.2 | 10.4 | 9.5 | 8.7 | 8.9 | 9.6 | 10.6 | 122.0 |
| Average snowy days (≥ 0.1 in) | 4.0 | 2.8 | 1.8 | 0.3 | 0 | 0 | 0 | 0 | 0 | 0 | 0.2 | 2.3 | 11.4 |
| Average relative humidity (%) | 61.5 | 60.2 | 58.5 | 55.3 | 62.7 | 65.2 | 64.2 | 66.0 | 67.8 | 65.6 | 64.6 | 64.1 | 63.0 |
| Average dew point °F (°C) | 18.0 (−7.8) |
19.0 (−7.2) |
25.9 (−3.4) |
34.0 (1.1) |
47.3 (8.5) |
57.4 (14.1) |
61.9 (16.6) |
62.1 (16.7) |
55.6 (13.1) |
44.1 (6.7) |
34.0 (1.1) |
24.6 (−4.1) |
40.3 (4.6) |
| Mean monthly sunshine hours | 162.7 | 163.1 | 212.5 | 225.6 | 256.6 | 257.3 | 268.2 | 268.2 | 219.3 | 211.2 | 151.0 | 139.0 | 2,534.7 |
| Percent possible sunshine | 54 | 55 | 57 | 57 | 57 | 57 | 59 | 63 | 59 | 61 | 51 | 48 | 57 |
| Average ultraviolet index | 2 | 3 | 4 | 6 | 7 | 8 | 8 | 8 | 6 | 4 | 2 | 1 | 5 |
| Source 1: NOAA (relative humidity and sun 1961–1990; dew point 1965–1984)[31][32][33][34] | |||||||||||||
| Source 2: Weather Atlas[22]
See Climate of New York City for additional climate information from the outer boroughs. | |||||||||||||
| Climate data for New York | |||||||||||||
|---|---|---|---|---|---|---|---|---|---|---|---|---|---|
| Month | Jan | Feb | Mar | Apr | May | Jun | Jul | Aug | Sep | Oct | Nov | Dec | Year |
| Average sea temperature °F (°C) | 41.7 (5.4) |
39.7 (4.3) |
40.2 (4.5) |
45.1 (7.3) |
52.5 (11.4) |
64.5 (18.1) |
72.1 (22.3) |
74.1 (23.4) |
70.1 (21.2) |
63.0 (17.3) |
54.3 (12.4) |
47.2 (8.4) |
55.4 (13.0) |
| Source: Weather Atlas[22] | |||||||||||||
Climate data for New York (Belvedere Castle, New York), 2010-2019 normals, extremes 2010-present | |||||||||||||
|---|---|---|---|---|---|---|---|---|---|---|---|---|---|
| Month | Jan | Feb | Mar | Apr | May | Jun | Jul | Aug | Sep | Oct | Nov | Dec | Year |
| Record high °F (°C) | 69 (21) |
78 (26) |
79 (26) |
92 (33) |
92 (33) |
95 (35) |
104 (40) |
96 (36) |
97 (36) |
93 (34) |
74 (23) |
71 (22) |
104 (40) |
| Mean maximum °F (°C) | 59.2 (15.1) |
60.3 (15.7) |
69.7 (20.9) |
83.7 (28.7) |
89.6 (32.0) |
92.7 (33.7) |
97.3 (36.3) |
92.8 (33.8) |
91.1 (32.8) |
82.0 (27.8) |
70.3 (21.3) |
63.2 (17.3) |
97.5 (36.4) |
| Average high °F (°C) | 39.1 (3.9) |
42.8 (6.0) |
50.1 (10.1) |
62.6 (17.0) |
72.5 (22.5) |
80.0 (26.7) |
86.4 (30.2) |
83.8 (28.8) |
77.8 (25.4) |
65.8 (18.8) |
53.6 (12.0) |
45.3 (7.4) |
63.3 (17.4) |
| Average low °F (°C) | 26.9 (−2.8) |
29.1 (−1.6) |
35.4 (1.9) |
45.8 (7.7) |
56.1 (13.4) |
64.3 (17.9) |
71.1 (21.7) |
69.4 (20.8) |
63.3 (17.4) |
52.6 (11.4) |
40.8 (4.9) |
34.6 (1.4) |
49.1 (9.5) |
| Mean minimum °F (°C) | 9.1 (−12.7) |
12.0 (−11.1) |
21.1 (−6.1) |
33.7 (0.9) |
45.2 (7.3) |
53.0 (11.7) |
62.8 (17.1) |
61.1 (16.2) |
52.7 (11.5) |
39.1 (3.9) |
27.4 (−2.6) |
21.2 (−6.0) |
6.4 (−14.2) |
| Record low °F (°C) | 2 (−17) |
−1 (−18) |
12 (−11) |
26 (−3) |
34 (1) |
50 (10) |
61 (16) |
59 (15) |
47 (8) |
33 (1) |
15 (−9) |
9 (−13) |
−1 (−18) |
| Source 1: NOAA (relative humidity and sun 1961–1990; dew point 1965–1984) | |||||||||||||
| Source 2: Weather Atlas
See Climate of New York City for additional climate information from the outer boroughs. | |||||||||||||
| Climate data for LaGuardia Airport, New York (1981–2010 normals,[lower-alpha 4] extremes 1939–present) | |||||||||||||
|---|---|---|---|---|---|---|---|---|---|---|---|---|---|
| Month | Jan | Feb | Mar | Apr | May | Jun | Jul | Aug | Sep | Oct | Nov | Dec | Year |
| Record high °F (°C) | 72 (22) |
79 (26) |
86 (30) |
94 (34) |
97 (36) |
101 (38) |
107 (42) |
104 (40) |
102 (39) |
95 (35) |
83 (28) |
75 (24) |
107 (42) |
| Mean maximum °F (°C) | 58.6 (14.8) |
60.1 (15.6) |
70.5 (21.4) |
81.2 (27.3) |
88.5 (31.4) |
93.4 (34.1) |
96.6 (35.9) |
94.4 (34.7) |
88.8 (31.6) |
79.7 (26.5) |
71.1 (21.7) |
62.1 (16.7) |
98.1 (36.7) |
| Average high °F (°C) | 39.3 (4.1) |
42.2 (5.7) |
49.8 (9.9) |
60.9 (16.1) |
71.2 (21.8) |
80.5 (26.9) |
85.3 (29.6) |
83.7 (28.7) |
76.3 (24.6) |
65.2 (18.4) |
54.7 (12.6) |
44.3 (6.8) |
62.9 (17.2) |
| Average low °F (°C) | 26.6 (−3.0) |
28.5 (−1.9) |
34.6 (1.4) |
44.4 (6.9) |
53.9 (12.2) |
63.8 (17.7) |
69.5 (20.8) |
68.9 (20.5) |
61.9 (16.6) |
51.0 (10.6) |
41.8 (5.4) |
32.1 (0.1) |
48.2 (9.0) |
| Mean minimum °F (°C) | 10.0 (−12.2) |
13.5 (−10.3) |
19.7 (−6.8) |
33.8 (1.0) |
45.2 (7.3) |
54.1 (12.3) |
62.0 (16.7) |
60.4 (15.8) |
50.9 (10.5) |
39.9 (4.4) |
29.3 (−1.5) |
16.6 (−8.6) |
7.5 (−13.6) |
| Record low °F (°C) | −3 (−19) |
−7 (−22) |
7 (−14) |
22 (−6) |
36 (2) |
46 (8) |
56 (13) |
51 (11) |
42 (6) |
30 (−1) |
17 (−8) |
−2 (−19) |
−7 (−22) |
| Average precipitation inches (mm) | 3.17 (81) |
2.76 (70) |
3.97 (101) |
4.00 (102) |
3.79 (96) |
3.94 (100) |
4.50 (114) |
4.12 (105) |
3.73 (95) |
3.78 (96) |
3.41 (87) |
3.56 (90) |
44.73 (1,136) |
| Average snowfall inches (cm) | 7.4 (19) |
9.1 (23) |
4.4 (11) |
0.5 (1.3) |
0 (0) |
0 (0) |
0 (0) |
0 (0) |
0 (0) |
0 (0) |
0.3 (0.76) |
5.2 (13) |
26.9 (68.06) |
| Average precipitation days (≥ 0.01 inch) | 10.3 | 9.6 | 10.7 | 10.9 | 11.1 | 10.5 | 9.9 | 8.7 | 8.1 | 8.5 | 9.2 | 10.5 | 118.0 |
| Average snowy days (≥ 0.1 inch) | 4.6 | 3.4 | 2.1 | 0.2 | 0 | 0 | 0 | 0 | 0 | 0 | 0.2 | 2.6 | 13.1 |
| Average relative humidity (%) | 61.0 | 60.2 | 59.5 | 59.3 | 63.8 | 64.6 | 64.7 | 67.0 | 67.2 | 65.2 | 64.2 | 63.5 | 63.4 |
| Source: NOAA (relative humidity 1961–1990)[35][36][37] | |||||||||||||
| Climate data for JFK Airport, New York (1981–2010 normals,[lower-alpha 4] extremes 1948–present) | |||||||||||||
|---|---|---|---|---|---|---|---|---|---|---|---|---|---|
| Month | Jan | Feb | Mar | Apr | May | Jun | Jul | Aug | Sep | Oct | Nov | Dec | Year |
| Record high °F (°C) | 71 (22) |
71 (22) |
85 (29) |
90 (32) |
99 (37) |
99 (37) |
104 (40) |
101 (38) |
98 (37) |
95 (35) |
77 (25) |
75 (24) |
104 (40) |
| Mean maximum °F (°C) | 56.8 (13.8) |
57.9 (14.4) |
68.5 (20.3) |
78.1 (25.6) |
84.9 (29.4) |
92.1 (33.4) |
94.5 (34.7) |
92.7 (33.7) |
87.4 (30.8) |
78.0 (25.6) |
69.1 (20.6) |
60.1 (15.6) |
96.6 (35.9) |
| Average high °F (°C) | 39.1 (3.9) |
41.8 (5.4) |
49.0 (9.4) |
59.0 (15.0) |
68.5 (20.3) |
78.0 (25.6) |
83.2 (28.4) |
81.9 (27.7) |
75.3 (24.1) |
64.5 (18.1) |
54.3 (12.4) |
44.0 (6.7) |
61.6 (16.4) |
| Average low °F (°C) | 26.3 (−3.2) |
28.1 (−2.2) |
34.2 (1.2) |
43.5 (6.4) |
52.8 (11.6) |
62.8 (17.1) |
68.5 (20.3) |
67.8 (19.9) |
60.8 (16.0) |
49.6 (9.8) |
40.7 (4.8) |
31.5 (−0.3) |
47.3 (8.5) |
| Mean minimum °F (°C) | 9.8 (−12.3) |
13.4 (−10.3) |
19.1 (−7.2) |
32.6 (0.3) |
42.6 (5.9) |
52.7 (11.5) |
60.7 (15.9) |
58.6 (14.8) |
49.2 (9.6) |
37.6 (3.1) |
27.4 (−2.6) |
16.3 (−8.7) |
7.5 (−13.6) |
| Record low °F (°C) | −2 (−19) |
−2 (−19) |
7 (−14) |
20 (−7) |
34 (1) |
45 (7) |
55 (13) |
46 (8) |
40 (4) |
30 (−1) |
15 (−9) |
2 (−17) |
−2 (−19) |
| Average precipitation inches (mm) | 3.16 (80) |
2.59 (66) |
3.78 (96) |
3.87 (98) |
3.94 (100) |
3.86 (98) |
4.08 (104) |
3.68 (93) |
3.50 (89) |
3.62 (92) |
3.30 (84) |
3.39 (86) |
42.77 (1,086) |
| Average snowfall inches (cm) | 6.3 (16) |
8.3 (21) |
3.5 (8.9) |
0.8 (2.0) |
0 (0) |
0 (0) |
0 (0) |
0 (0) |
0 (0) |
0 (0) |
0.2 (0.51) |
4.7 (12) |
23.8 (60) |
| Average precipitation days (≥ 0.01 inch) | 10.5 | 9.6 | 11.0 | 11.4 | 11.5 | 10.7 | 9.4 | 8.7 | 8.1 | 8.5 | 9.4 | 10.6 | 119.4 |
| Average snowy days (≥ 0.1 inch) | 4.6 | 3.4 | 2.3 | 0.3 | 0 | 0 | 0 | 0 | 0 | 0 | 0.2 | 2.8 | 13.6 |
| Average relative humidity (%) | 64.9 | 64.4 | 63.4 | 64.1 | 69.5 | 71.5 | 71.4 | 71.7 | 71.9 | 69.1 | 67.9 | 66.3 | 68.0 |
| Source: NOAA (relative humidity 1961–1990)[35][38][39] | |||||||||||||
- Time series plot for Central Park, 1869–present
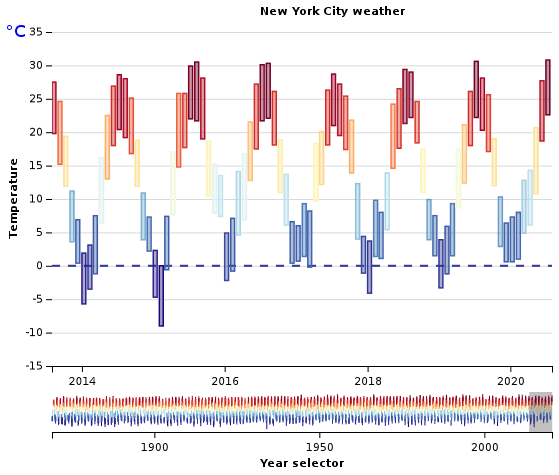
See or edit raw graph data.
Notes
- Mid-latitude temperate maritime climate
- Mean monthly maxima and minima (i.e. the expected highest and lowest temperature readings at any point during the year or given month) calculated based on data at said location from 1981 to 2010.
- Official weather observations for Central Park were conducted at the Arsenal at Fifth Avenue and 64th Street from 1869 to 1919, and at Belvedere Castle since 1919.[30]
- Mean monthly maxima and minima (i.e. the expected highest and lowest temperature readings at any point during the year or given month) calculated based on data at said location from 1981 to 2010.
References
- Peel, M.C.; Finlayson, B.L. "World Map of Köppen-Geiger climate classification". The University of Melbourne. Archived from the original on January 13, 2015. Retrieved 27 June 2020.
- "Station Data Inventory, Access & History". NOAA. Retrieved 27 June 2020.
- "Warmest and Coldest Days at Central Park (1869 to Present)" (PDF). NOAA. Retrieved 27 June 2020.
- "Search | Climate Data Online (CDO) | National Climatic Data Center (NCDC)". Archived from the original on 29 July 2019. Retrieved 5 July 2020.
- https://www.weather.gov/media/okx/Climate/CentralPark/extremes.pdf
- Peel, M.C.; Finlayson, B.L. "World Map of Köppen-Geiger climate classification". The University of Melbourne. Archived from the original on January 13, 2015. Retrieved 27 June 2020.
- "Trewartha maps". kkh.ltrr.arizona.edu. Retrieved 27 June 2020.
- Cmapm, Kliimavöötmed svg: Urmasderivative work (2011-06-16), Русский: Климатические пояса Земли по Б. П. Алисову., retrieved 27 June 2020
- "World Strahler Climate Map". Retrieved 27 June 2020.
- Feddema, Johannes J. (January 2005). "A Revised Thornthwaite-Type Global Climate Classification". Physical Geography. 26 (6): 442–466. doi:10.2747/0272-3646.26.6.442. ISSN 0272-3646.
- "Klimaklassifikation". www.spektrum.de (in German). Retrieved 27 June 2020.
- "The Holdridge life zones of the conterminous United States in relation to ecosystem mapping".
Figure 3
- "Search | Climate Data Online (CDO) | National Climatic Data Center (NCDC)". Archived from the original on 29 July 2019. Retrieved 5 July 2020.
- "Station Name: NY NEW YORK CNTRL PK TWR". National Oceanic and Atmospheric Administration. Retrieved 2018-04-10.
- "Station Name: Temperaturmonatsmittel NEW YORK CENTRAL PARK 1821- 1987". Wetter-Zentrale. Retrieved 2020-07-07.
- "Central Park, NY Historical Data". NOAA. Retrieved 27 June 2020.
- "Record Wet and Dry Years and Months at CPK". NWS Upton, New York. Retrieved 2020-07-05.
- "Monthly & Seasonal Snowfall at Central Park". National Oceanic and Atmospheric Administration. Retrieved 2020-07-05.
- "Station Name: NY NEW YORK CNTRL PK TWR". National Oceanic and Atmospheric Administration. Retrieved 2018-04-10.
- https://www.weather.gov/okx/CentralParkHistorical
- https://www.gps-coordinates.net/
- "New York, New York, USA - Monthly weather forecast and Climate data". Weather Atlas. Retrieved 4 July 2019.
- "NowData - NOAA Online Weather Data". National Oceanic and Atmospheric Administration. Retrieved 2018-04-10.
- https://www.weather.gov/media/okx/Climate/CentralPark/extremes.pdf
- https://www1.nyc.gov/site/cdbgdr/about/About%20Hurricane%20Sandy.page#:~:text=Impact%20of%20Hurricane%20Sandy&text=The%20storm%20resulted%20in%20the,New%20Yorkers%20were%20temporarily%20displaced.
- https://www.theverge.com/2019/3/14/18265833/new-york-city-climate-change-sea-level-rise-bill-de-blasio-development
- https://eu.usatoday.com/story/news/nation/2019/02/12/global-warming-climate-change-shift-climates-south/2847860002/
- https://www.dec.ny.gov/energy/94702.html#:~:text=The%20annual%20average%20temperature%20statewide,northern%20parts%20of%20New%20York.
- https://newyorkyimby.com/2017/12/why-new-york-citys-rapidly-rising-snowfall-totals-are-no-holiday-miracle.html
- Belvedere Castle at NYC Parks
- "NowData - NOAA Online Weather Data". National Oceanic and Atmospheric Administration. Retrieved 2018-04-10.
- "Station Name: NY NEW YORK CNTRL PK TWR". National Oceanic and Atmospheric Administration. Retrieved 2018-04-10.
- "New York Central Park, NY Climate Normals 1961−1990". NOAA. Retrieved 2020-07-18.
- "Average Percent Sunshine through 2009". National Climatic Data Center. Retrieved 2012-11-14.
- "NowData - NOAA Online Weather Data". National Oceanic and Atmospheric Administration. Retrieved 2020-07-22.
- "Station Name: NY NEW YORK LAGUARDIA AP". National Oceanic and Atmospheric Administration. Retrieved 2016-09-11.
- "NEW YORK/LAGUARDIA ARPT NY Climate Normals 1961−1990". NOAA. Retrieved 2014-03-23.
- "Station Name: NY NEW YORK JFK INTL AP". National Oceanic and Atmospheric Administration. Retrieved 2016-09-11.
- "NEW YORK/JFK, NY Climate Normals 1961−1990". NOAA. Retrieved 2014-03-23.
| By topic |  | |
|---|---|---|
| Boroughs |
| |
| Government |
| |
| Emergency services | ||
| Transportation | ||
| Culture | ||
| Education | ||
| ||