Wealth inequality in the United States
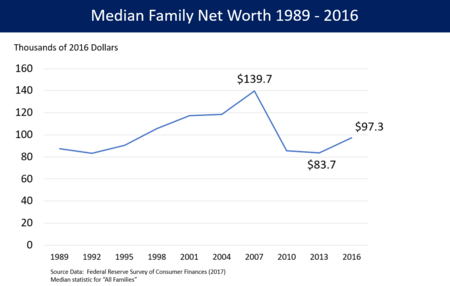
Wealth inequality in the United States, also known as the wealth gap,[2] is the unequal distribution of assets among residents of the United States. Wealth includes the values of homes, automobiles, personal valuables, businesses, savings, and investments.[3] The net worth of U.S. households and non-profit organizations was $107 trillion in the third quarter of 2019, a record level both in nominal terms and purchasing power parity.[4] As of Q3 2019, the bottom 50% of households had $1.67 trillion or 1.6% of the net worth, versus $74.5 trillion or 70% for the top 10%.[5] From an international perspective, the difference in US median and mean wealth per adult is over 600%.[6]
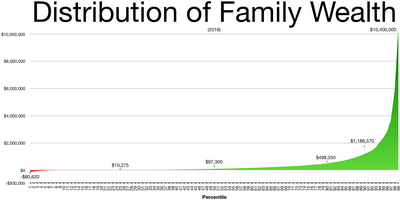
Just prior to President Obama's 2014 State of the Union Address, media[7] reported that the top wealthiest 1% possess 40% of the nation's wealth; the bottom 80% own 7%.[8] The gap between the top 10% and the middle class is over 1,000%; that increases another 1,000% for the top 1%. The average employee "needs to work more than a month to earn what the CEO earns in one hour."[9] Although different from income inequality, the two are related. In Inequality for All—a 2013 documentary with Robert Reich in which he argued that income inequality is the defining issue for the United States—Reich states that 95% of economic gains went to the top 1% net worth (HNWI) since 2009 when the recovery allegedly started.[10] More recently, in 2017, an Oxfam study found that eight rich people, six of them Americans, own as much combined wealth as half the human race.[11][12][13]
A 2011 study found that US citizens across the political spectrum dramatically underestimate the current US wealth inequality and would prefer a far more egalitarian distribution of wealth.[15]
Wealth is usually not used for daily expenditures or factored into household budgets, but combined with income it comprises the family's total opportunity to secure a desired stature and standard of living, or pass their class status along to one's children.[16] Moreover, wealth provides for both short- and long-term financial security, bestows social prestige, and contributes to political power, and can be used to produce more wealth.[17] Hence, wealth possesses a psychological element that awards people the feeling of agency, or the ability to act. The accumulation of wealth grants more options and eliminates restrictions about how one can live life. Dennis Gilbert asserts that the standard of living of the working and middle classes is dependent upon income and wages, while the rich tend to rely on wealth, distinguishing them from the vast majority of Americans.[18] A September 2014 study by Harvard Business School declared that the growing disparity between the very wealthy and the lower and middle classes is no longer sustainable.[19]
Statistics
In 2007, the top 20% wealthiest possessed 80% of all financial assets.[21] In 2007 the richest 1% of the American population owned 35% of the country's total wealth, and the next 19% owned 51%. The top 20% of Americans owned 86% of the country's wealth and the bottom 80% of the population owned 14%. In 2011, financial inequality was greater than inequality in total wealth, with the top 1% of the population owning 43%, the next 19% of Americans owning 50%, and the bottom 80% owning 7%.[22] However, after the Great Recession which started in 2007, the share of total wealth owned by the top 1% of the population grew from 35% to 37%, and that owned by the top 20% of Americans grew from 86% to 88%. The Great Recession also caused a drop of 36% in median household wealth, but a drop of only 11% for the top 1%, further widening the gap between the top 1% and the bottom 99%.[20][22][23]
According to PolitiFact and others, in 2011 the 400 wealthiest Americans have more wealth than half of all Americans combined.[24][25] Inherited wealth may help explain why many Americans who have become rich may have had a substantial head start.[26][27] In September 2012, according to the Institute for Policy Studies, over 60 percent of the Forbes richest 400 Americans grew up in substantial privilege.[28]
In 2013, wealth inequality in the U.S. was greater than in most developed countries other than Switzerland and Denmark.[30] In the United States, the use of offshore holdings is exceptionally small compared to Europe, where much of the wealth of the top percentiles is kept in offshore holdings.[31] While the statistical problem is Europe-wide, in Southern Europe statistics become even more unreliable. Fewer than a thousand people in Italy have declared incomes of more than 1 million euros. Former Prime Minister of Italy described tax evasion as a "national pastime".[32][33] According to a 2014 Credit Suisse study, the ratio of wealth to household income is the highest it has been since the Great Depression.[34]
According to a paper published by the Federal Reserve in 1997, "For most households, pensions and Social Security are the most important sources of income during retirement, and the promised benefit stream constitutes a sizable fraction of household wealth" and "including pensions and Social Security in net worth makes the distribution more even".[35] However, many of the basic assumptions of this paper are no longer valid a generation later, as the basic relationship between employer and employee has changed. The first line of the paper reads, "Approximately half of all U.S. households are covered by employer provided pensions from a current or past job." While this may have been true in 1997, in the year 2019, the number of Americans covered by defined-benefit retirement plans has dropped to less than 20%, thus negating many of the paper's conclusions.
A September 2017 study by the Federal Reserve reported that the top 1% owned 38.5% of the country's wealth in 2016.[36]
According to a June 2017 report by the Boston Consulting Group, around 70% of the nation's wealth will be in the hands of millionaires and billionaires by 2021.[37]
A 2019 study by economists Emmanuel Saez and Gabriel Zucman found that the average effective tax rate paid by the richest 400 families (0.003%) in the country was 23 percent, a full percentage point lower than the 24.2 percent rate paid by the bottom half of American households.[38][39] The Urban-Brookings Tax Policy Center found that the bottom 20 percent of earners pay an average 2.9 percent effective federal income tax rate while the richest top 1 percent paid an effective 29.6 percent tax rate and the top 0.01 percent paid an effective 30.6 percent tax rate.[40] In 2019, the Institute on Taxation and Economic Policy found when state and federal taxes are taken into account, the poorest 20 percent pay an effective 20.2 percent rate while the top 1 percent pay an effective 33.7 percent rate.[41]
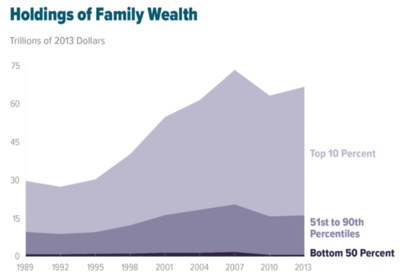
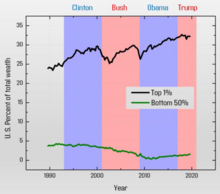
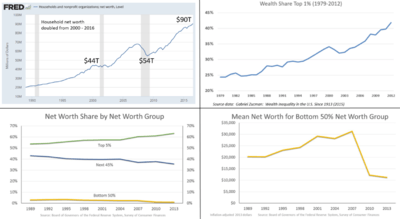
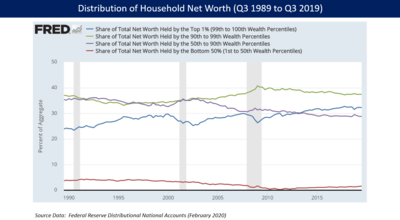
Using Federal Reserve data, the Washington Center for Equitable Growth reported in August 2019 that: "Looking at the cumulative growth of wealth disaggregated by group, we see that the bottom 50 percent of wealth owners experienced no net wealth growth since 1989. At the other end of the spectrum, the top 1 percent have seen their wealth grow by almost 300 percent since 1989. Although cumulative wealth growth was relatively similar among all wealth groups through the 1990s, the top 1 percent and bottom 50 percent diverged around 2000."[42]
Early 20th century
Pioneering work by Simon Kuznets using income tax records and his own well-researched estimates of national income showed a reduction of about 10% in the portion of national income going to the top 10%, a reduction from about 45–50% in 1913 to about 30–35% in 1948.[43] This period spans both The Great Depression and World War II, events with significant economic consequences. This is called the Great Compression.
Changes during Trump Administration
The Federal Reserve publishes information on the distribution of household wealth by quarter going back to 1989. From Q4 2016 (the end of the Obama Administration) to Q4 2019, nominal household net worth in total increased by $20.4 trillion or about 22%, driven primarily by stock market gains. Since the bottom 50% of U.S. households measured by net worth have little if any stock market exposure (neither directly nor indirectly through 401k plans[44]), that group received $0.58 trillion of that gain, about 3% (i.e., 0.58/20.4). The top 1% received 37% of that gain, the 90-99th percentile received 35%, and the 50th-90th percentile received 25%. The following table summarizes the Fed data:[5]
| Household Net Worth | Top 1% | 90th to 99th | 50th to 90th | Bottom 50% | Total |
|---|---|---|---|---|---|
| Q4 2016 ($ trillions) | 29.18 | 34.59 | 26.53 | 1.08 | 91.38 |
| Q4 2019 ($ trillions) | 36.80 | 41.69 | 31.63 | 1.66 | 111.78 |
| Increase ($ trillions) | 7.62 | 7.10 | 5.10 | 0.58 | 20.4 |
| % Increase | 26% | 21% | 19% | 54% | 22% |
| Share of Increase (Increase/Total Increase) | 37% | 35% | 25% | 3% | 100% |
| (Intentionally left blank) | |||||
| Share of Net Worth Q4 2016 | 31.9% | 37.9% | 29.0% | 1.2% | 100% |
| Share of Net Worth Q4 2019 | 32.9% | 37.3% | 28.3% | 1.5% | 100% |
| Change in Share | +0.99% | -0.56% | -0.74% | +0.30% | 0.0% |
Wealth and income
There is an important distinction between income and wealth. Income refers to a flow of money over time in the form of a rate (per hour, per week, or per year); wealth is a collection of assets owned minus liabilities. In essence, income is specifically what people receive through work, retirement, or social welfare whereas wealth is what people own.[45] While the two are seemingly related, income inequality alone is insufficient for understanding economic inequality for two reasons:
- It does not accurately reflect an individual's economic position
- Income does not portray the severity of financial inequality in the United States.
The United States Census Bureau formally defines income as received on a regular basis (exclusive of certain money receipts such as capital gains) before payments for personal income taxes, social security, union dues, medicare deductions, etc.[46] By this official measure, the wealthiest families may have low income, but the value of their assets earns enough money to support their lifestyle. Dividends from trusts or gains in the stock market do not fall under the definition of income but are the primary money flows for the wealthy. Retired people also have little income but usually have a higher net worth because of money saved over time.[47]
Additionally, income does not capture the extent of wealth inequality. Wealth is derived over time from the collection of income earnings and growth of assets. The income of one year cannot encompass the accumulation over a lifetime. Income statistics view too narrow a time span for it to be an adequate indicator of financial inequality. For example, the Gini coefficient for wealth inequality increased from 0.80 in 1983 to 0.84 in 1989. In the same year, 1989, the Gini coefficient for income was only 0.52.[47] The Gini coefficient is an economic tool on a scale from 0 to 1 that measures the level of inequality. 1 signifies perfect inequality and 0 represents perfect equality. From this data, it is evident that in 1989 there was a discrepancy about the level of economic disparity with the extent of wealth inequality significantly higher than income inequality. Recent research shows that many households, in particular those headed by young parents (younger than 35), minorities, and individuals with low educational attainment, display very little accumulation. Many have no financial assets and their total net worth is also low.[48]
According to the Congressional Budget Office, between 1979 and 2007 incomes of the top 1% of Americans grew by an average of 275%. ... (Note: The IRS insists that comparisons of adjusted gross income pre-1987 and post-1987 are complicated by large changes in the definition of AGI led to households in the top income quintile reporting a lot more of their income in their individual income tax form's AGI, rather than reporting their business income in separate corporate tax returns, or not reporting certain non-taxable income in their AGI at all, such as municipal bond income. Anyone who wants to discuss incomes in the U.S. fairly must include a chart of all available data split by quintile up to the mid-1980s. That should be followed by a chart from 1990 to 2011. The five-year gap would avoid the major AGI definition changes. The big picture of this subject is not just a segment of all available data starting in 1979, especially after the IRS warned about the large AGI definition changes in the late 1980s). In addition, IRS studies consistently show a majority of households in the top income quintile have moved to a lower quintile within one decade. There are even more changes to households in the top 1%. Without including those data here, a reader is likely to assume households in the Top 1% are almost the same from year to year.)[49] In 2009, people in the top 1% of taxpayers made $343,927 or more.[50][51][52] According to US economist Joseph Stiglitz the richest 1% of Americans gained 93% of the additional income created in 2010.[53][54] A study by Emmanuel Saez and Piketty showed that the top 10 percent of earners took more than half of the country's total income in 2012, the highest level recorded since the government began collecting the relevant data a century ago.[55] People in the top one percent were three times more likely to work more than 50 hours a week, were more likely to be self-employed, and earned a fifth of their income as capital income.[56] The top one percent was composed of many professions and had an annual turnover rate of more than 25%.[57] The five most common professions were managers, physicians, administrators, lawyers, and teachers.[56]
In the book Modern Labor Economics: Theory and Public Policy, it is noted that in the United States all income that employees received from their employers in 2012 was 8.6 trillion dollars while the amount of money received from all other sources of personal income in that year came to 5.3 trillion dollars. This makes the relationship of employee to employer and vocational employment in general of paramount importance in the United States.[58]
U.S. stock market ownership distribution
| Stock owned by richest 10%.[44][59] | |
| 2016 | 84% |
| 2013 | 81% |
| 2001 | 71% |
In March 2017, NPR summarized the distribution of U.S. stock market ownership (direct and indirect through mutual funds) in the U.S., which is highly concentrated among the wealthiest families:[44]
- 52% of U.S. adults owned stock in 2016. Ownership peaked at 65% in 2007 and fell significantly due to the Great Recession.
- As of 2013, the top 1% of households owned 38% of stock market wealth.
- As of 2013, the top 10% own 81% of stock wealth, the next 10% (80th to 90th percentile) own 11% and the bottom 80% own 8%.
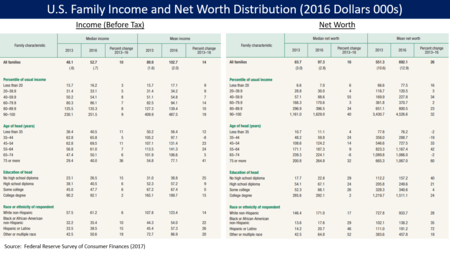
The Federal Reserve reported the median value of stock ownership by income group for 2016:
- Bottom 20% own $5,800.
- 20th-40th percentile own $10,000.
- 40th to 60th percentile own $15,500.
- 60th to 80th percentile own $31,700.
- 80th to 89th percentile own $82,000.
- Top 10% own $365,000.[61]
NPR reported that when politicians reference the stock market as a measure of economic success, that success is not relevant to nearly half of Americans. Further, more than one-third of Americans who work full-time have no access to pensions or retirement accounts such as 401(k)s that derive their value from financial assets like stocks and bonds.[44] The NYT reported that the percentage of workers covered by generous defined-benefit pension plans has declined from 62% in 1983 to 17% by 2016.[61] While some economists consider an increase in the stock market to have a "wealth effect" that increases economic growth, economists like Former Dallas Federal Reserve Bank President Richard Fisher believe those effects are limited.[44]
Causes of wealth inequality
Essentially, the wealthy possess greater financial opportunities that allow their money to make more money. Earnings from the stock market or mutual funds are reinvested to produce a larger return. Over time, the sum that is invested becomes progressively more substantial. Those who are not wealthy, however, do not have the resources to enhance their opportunities and improve their economic position. Rather, "after debt payments, poor families are constrained to spend the remaining income on items that will not produce wealth and will depreciate over time."[65] Scholar David B. Grusky notes that "62 percent of households headed by single parents are without savings or other financial assets."[66] Net indebtedness generally prevents the poor from having any opportunity to accumulate wealth and thereby better their conditions.
Economic inequality is a result of difference in income. Factors that contribute to this gap in wages are things such as level of education, labor market demand and supply, gender differences, growth in technology, and personal abilities. The quality and level of education that a person has often corresponds to their skill level, which is justified by their income. Wages are also determined by the "market price of a skill" at that current time. Although gender inequality is a separate social issue, it plays a role in economic inequality. According to the U.S. Census Report, in America the median full-time salary for women is 77 percent of that for men. Also contributing to the wealth inequality in the U.S., both unskilled and skilled workers are being replaced by machinery. The Seven Pillars Institute for Global Finance and Ethics argues that because of this "technological advance", the income gap between workers and owners has widened.[67]
Income inequality contributes to wealth inequality. For example, economist Emmanuel Saez wrote in June 2016 that the top 1% of families captured 52% of the total real income (GDP) growth per family from 2009-2015. From 2009 to 2012, the top 1% captured 91% of the income gains.[68]
Notably, for both the wealthy and not-wealthy, the process of accumulation or debt is cyclical. The rich use their money to earn larger returns and the poor have no savings with which to produce returns or eliminate debt. Unlike income, both facets are generational. Wealthy families pass down their assets allowing future generations to develop even more wealth. The poor, on the other hand, are less able to leave inheritances to their children leaving the latter with little or no wealth on which to build...This is another reason why wealth inequality is so important. Its accumulation has direct implications for economic inequality among the children of today's families.[65]
Corresponding to financial resources, the wealthy strategically organize their money so that it will produce profit. Affluent people are more likely to allocate their money to financial assets such as stocks, bonds, and other investments which hold the possibility of capital appreciation. Those who are not wealthy are more likely to have their money in savings accounts and home ownership.[69] This difference comprises the largest reason for the continuation of wealth inequality in America: the rich are accumulating more assets while the middle and working classes are just getting by. As of 2007, the richest 1% held about 38% of all privately held wealth in the United States.[21] while the bottom 90% held 73.2% of all debt.[65] According to The New York Times, the richest 1 percent in the United States now own more wealth than the bottom 90 percent.[8]
However, other studies argue that higher average savings rate will contribute to the reduction of the share of wealth owned by the rich. The reason is that the rich in wealth are not necessarily the individuals with the highest income. Therefore, the relative wealth share of poorer quintiles of the population would increase if the savings rate of income is very large, although the absolute difference from the wealthiest will increase.[70][71][72]
The nature of tax policies in America has been suggested by economists and politicians such as Emmanuel Saez, Thomas Piketty, and Barack Obama to perpetuate economic inequality in America by steering large sums of wealth into the hands of the wealthiest Americans. The mechanism for this is that when the wealthy avoid paying taxes, wealth concentrates to their coffers and the poor go into debt.[73]
The economist Joseph Stiglitz argues that "Strong unions have helped to reduce inequality, whereas weaker unions have made it easier for CEOs, sometimes working with market forces that they have helped shape, to increase it." The long fall in unionization in the U.S. since WWII has seen a corresponding rise in the inequality of wealth and income.[74]
Racial disparities
The wealth gap between white and black families nearly tripled from $85,000 in 1984 to $236,500 in 2009.[75]
There are many causes, including years of home ownership, household income, unemployment, and education, but inheritance might be the most important.[75] Inheritance can directly link the disadvantaged economic position and prospects of today's blacks to the disadvantaged positions of their parents' and grandparents' generations. According to a report done by Robert B. Avery and Michael S. Rendall, "one in three white households will receive a substantial inheritance during their lifetime compared to only one in ten black households."[76] This relative lack of inheritance that has been observed among African Americans can be attributed in large part to factors such as unpaid labor (slavery), violent destruction of personal property in incidents such as Red Summer of 1919, unequal opportunity in education and employment (racial discrimination), and more recent policies such as redlining and planned shrinkage. Other ethnic minorities, particularly those with darker complexions, have at times faced many of these same adversities to various degrees.[77]
The article "America's Financial Divide" added context to racial wealth inequality stating "…nearly 96.1 percent of the 1.2 million households in the top one percent by income were white, a total of about 1,150,000 households. In addition, these families were found to have a median net asset worth of $8.3 million. In stark contrast, in the same piece, black households were shown as a mere 1.4 percent of the top one percent by income, that's only 16,800 homes. In addition, their median net asset worth was just $1.2 million. Using this data as an indicator only several thousand of the over 14 million African American households have more than $1.2 million in net assets… Relying on data from Credit Suisse and Brandeis University's Institute on Assets and Social Policy, the Harvard Business Review in the article "How America's Wealthiest Black Families Invest Money" recently took the analysis above a step further. In the piece the author stated "If you're white and have a net worth of about $356,000, that's good enough to put you in the 72nd percentile of white families. If you're black, it's good enough to catapult you into the 95th percentile." This means 28 percent of the total 83 million white homes, or over 23 million white households, have more than $356,000 in net assets. While only 700,000 of the 14 million black homes have more than $356,000 in total net worth." According to Inequality.org, the median black family is actually only worth $1,700 when you deduct these durables. In contrast, the median white family holds $116,800 of wealth using the same accounting methods. Today, using Wolff’s analysis, the median African American family holds a mere 1.5 percent of median white American family wealth.
A recent piece on Eurweb/Electronic Urban Report "Black Wealth Hardly Exists, Even When You Include NBA, NFL and Rap Stars" stated this about the difference between black middle class families and white middle class families. "Going even further into the data, a recent study by the Institute for Policy Studies (IPS) and the Corporation For Economic Development (CFED) found that it would take 228 years for the average black family to amass the same level of wealth the average white family holds today in 2016. All while white families create even more wealth over those same two hundred years. In fact, this is a gap that will never close if America stays on its current economic path. According to the Institute on Assets and Social Policy, for each dollar of increase in average income an African American household saw from 1984 to 2009 just $0.69 in additional wealth was generated, compared with the same dollar in increased income creating an additional $5.19 in wealth for a similarly situated white household."
Author Lilian Singh wrote on why the perceptions about black life created by media are misleading in the American Prospect piece "Black Wealth On TV: Realities Don’t Match Perceptions". "Black programming features TV shows that collectively create false perceptions of wealth for African-American families. The images displayed are in stark contrast to the economic conditions the average black family is battling each day."
In an article on Huffington Post by Antonio Moore "The Decadent Veil: Black America's Wealth Illusion" the question of inequity is taken another critical step forward and the piece digs into how celebrity is masking this massive inequality. Excerpt: "The decadent veil looks at black Americans through a lens of group theory and seeks to explain an illusion that has taken form over a 30-year span of financial deregulation and new found access to unsecured credit. This veil is trimmed with million-dollar sports contracts, Roc Nation tour deals and designer labels made for heads of state. As black celebrity invited us into their homes through shows like MTV cribs, we forgot the condition of overall African American financial affairs. Despite a large section of the 14 million black households drowning in poverty and debt the stories of a few are told as if they represent those of millions, not thousands. It is this new veil of economics that has allowed for a broad swath of America to become not just desensitized to black poverty, but also hypnotized by black celebrity… The decadent veil not only warps the black community's vision outward to a larger economic world, but it also distorts outside community's view of Black America's actual financial reality."
According to an article by the Pew research Center, the median wealth of non-Hispanic black households fell nearly 38% from 2010 to 2013.[78] During that time, the median wealth of those households fell from $16,600 to $13,700. The median wealth of Hispanic families fell 14.3 % as well, from $16,000 to $14,000. Despite the median net worth of all households in the United States decreasing with time, as of 2013, white households had a median net worth of $141,900 while black house households had a median net worth of just $11,000[78]. Hispanic households had a median net worth of just $13,700 over that time as well.[78]
Effect on democracy

A 2014 study by researchers at Princeton and Northwestern concludes that government policies reflect the desires of the wealthy, and that the vast majority of American citizens have "minuscule, near-zero, statistically non-significant impact upon public policy … when a majority of citizens disagrees with economic elites and/or with organized interests, they generally lose."[79][80][81] When Fed chair Janet Yellen was questioned by Bernie Sanders about the study at a congressional hearing in May 2014, she responded "There’s no question that we’ve had a trend toward growing inequality" and that this trend "can shape [and] determine the ability of different groups to participate equally in a democracy and have grave effects on social stability over time."[82]
In Capital in the Twenty-First Century, French economist Thomas Piketty argues that "extremely high levels" of wealth inequality are "incompatible with the meritocratic values and principles of social justice fundamental to modern democratic societies" and that "the risk of a drift towards oligarchy is real and gives little reason for optimism about where the United States is headed."[83]
According to Jedediah Purdy, a researcher at the Duke School of Law, the inequality of wealth in the United States has constantly opened the eyes of the many problems and shortcomings of its financial system over at least the last fifty years of the debate. For years, people believed that distributive justice would produce a sustainable level of wealth inequality. It was also thought that a certain state would be able to effectively diminish the amount of inequality that would occur. Something that was for the most part not expected is the fact that the inequality levels created by the growing markets would lessen the power of that state and prevent the majority of the political community from actually being able to deliver on its plans of distributive justice, however it has just lately come to attention of the mass majority.
Effect on health and well being
The 2019 World Happiness Report shows the US slipping to 19th place due to increasing wealth inequality, along with rising healthcare costs, surging addiction rates, and an unhealthy work–life balance.[84]
Proposals to reduce wealth inequality
Taxation of wealth
Senator Bernie Sanders pitched the idea of a wealth tax in the US in 2014.[86] Later, Senator Elizabeth Warren proposed an annual tax on wealth in January 2019, specifically a 2% tax for wealth over $50 million and another 1% surcharge on wealth over $1 billion. Wealth is defined as including all asset classes, including financial assets and real estate. Economists Emmanuel Saez and Gabriel Zucman estimated that about 75,000 households (less than 0.1%) would pay the tax. The tax would raise around $2.75 trillion over 10 years, roughly 1% GDP on average per year. This would raise the total tax burden for those subject to the wealth tax from 3.2% relative to their wealth under current law to about 4.3% on average, versus the 7.2% for the bottom 99% families.[87] For scale, the federal budget deficit in 2018 was 3.9% GDP and is expected to rise towards 5% GDP over the next decade.[88] The plan received both praise and criticism. Two billionaires, Michael Bloomberg and Howard Schultz, criticized the proposal as "unconstitutional" and "ridiculous," respectively. Warren was not surprised by this reaction, stating: "Another billionaire who thinks that billionaires shouldn't pay more in taxes."[89] Economist Paul Krugman wrote in January 2019 that polls indicate the idea of taxing the rich more is very popular.[90]
Limit or tax stock buybacks
Senators Charles Schumer and Bernie Sanders advocated limiting stock buybacks in January 2019. They explained that from 2008-2017, 466 of the S&P 500 companies spent $4 trillion on stock buybacks, about 50% of profits, with another 40% going to dividends. During 2018 alone, a record $1 trillion was spent on buybacks. Stock buybacks shift wealth upwards, because the top 1% own about 40% of shares and the top 10% own about 85%. Further, corporations directing profits to shareholders are not reinvesting the money in the firm or paying workers more. They wrote: "If corporations continue to purchase their own stock at this rate, income disparities will continue to grow, productivity will suffer, the long-term strength of companies will diminish — and the American worker will fall further behind." Their proposed legislation would prohibit buybacks unless the corporation has taken other steps first, such as paying workers more, providing more benefits such as healthcare and pensions, and investing in the community. To prevent corporations from shifting from buybacks to dividends, they proposed limiting dividends, perhaps by taking action through the tax code.[91]
See also
- Affluence in the United States
- Distribution of wealth in Europe
- Citizens United v. Federal Election Commission
- Donor Class
- Income inequality in the United States
- Monetary policy
- Net worth
- Occupy movement
- Occupy Wall Street
- Oligarchy
- Panama Papers
- Paradise Papers
- Pareto principle
- Plutocracy
- Power elite
- Redistribution of wealth
- Tax Policy and Economic Inequality in the United States
- The Divide: American Injustice in the Age of the Wealth Gap
- Wealth concentration
- Wealth in the United States
- We are the 99%
- American upper class
- List of Americans by net worth
References
- "Trends in Family Wealth, 1989 to 2013". Congressional Budget Office. August 18, 2016. Retrieved November 29, 2016.
- Rugaber, Christopher S.; Boak, Josh (January 27, 2014). "Wealth gap: A guide to what it is, why it matters". AP News. Retrieved January 27, 2014.
- Hurst, Charles E. (2007), Social Inequality: Forms, Causes, and Consequences, Pearson Education, Inc., p. 31, ISBN 978-0-205-69829-5
- "FRED Graph - St. Louis Fed". FRED. March 23, 2018. Retrieved March 23, 2018.
- "Distributional National Acounts". federalreserve.gov. February 16, 2020. Retrieved February 20, 2020. Cite journal requires
|journal=(help) - Anthony Shorrocks; Jim Davies; Rodrigo Lluberas (October 2018). "Global Wealth Report". Credit Suisse. Cite journal requires
|journal=(help) October 10, 2018 article: Global Wealth Report 2018: US and China in the lead. Report. Databook. Downloadable data sheets. See Table 3.1 (page 114) of databook for mean and median wealth by country. See page 106 (end of Table 2.4) for total wealth of continents. - Boyer, Dave (January 24, 2014), "Obama to use State of the Union as opening salvo in 2014 midterms", Washington Times, retrieved January 26, 2014
- Kristof, Nicholas (July 22, 2014). "An Idiot's Guide to Inequality". The New York Times. Retrieved July 22, 2014.
- Marsden, William (January 26, 2014), Obama's State of the Union speech will be call to arms on wealth gap, retrieved January 26, 2014
- Svaldi, Aldo (January 11, 2014). "Robert Reich: Income inequality the defining issue for U.S." The Denver Post. Retrieved January 26, 2014.
- Ratcliff, Anna (January 16, 2017). "Just 8 men own same wealth as half the world". Oxfam. Retrieved January 16, 2017.
- Mullany, Gerry (January 16, 2017). "World's 8 Richest Have as Much Wealth as Bottom Half of Global Population". New York Times. Retrieved January 16, 2017.
- Elliott, Larry (January 15, 2017). "World's eight richest people have same wealth as poorest 50%". The Guardian. Retrieved January 16, 2017.
- Top 1% Up $21 Trillion. Bottom 50% Down $900 Billion. By Matt Bruenig. June 14, 2019. People’s Policy Project.
- Norton, M.I.; Ariely, D. (2011). "Building a Better America – One Wealth Quintile at a Time" (PDF). Perspectives on Psychological Science. 6 (1): 9–12. doi:10.1177/1745691610393524. PMID 26162108. (video)
- Grusky, David B. Social Stratification: Class, Race, and Gender in Sociological Perspective, p. 637. Westview Press, 2001 ISBN 0-8133-6654-2
- Keister, p. 64
- Gilbert, D. (1998). The American Class Structure: In an Age of the Growing Inequality. Belmont, CA: Wadsworth.
- America's wealth gap 'unsustainable,' may worsen: Harvard study. Reuters, September 8, 2014.
- Recent Trends in Household Wealth in the United States: Rising Debt and the Middle-Class Squeeze—an Update to 2007 by Edward N. Wolff, Levy Economics Institute of Bard College, March 2010
- Hurst, p. 34
- Occupy Wall Street And The Rhetoric of Equality Forbes November 1, 2011 by Deborah L. Jacobs
- Wealth, Income, and Power by G. William Domhoff of the UC-Santa Barbara Sociology Department
- Kertscher, Tom; Borowski, Greg (March 10, 2011). "The Truth-O-Meter Says: True – Michael Moore says 400 Americans have more wealth than half of all Americans combined". PolitiFact. Retrieved August 11, 2013.
- Pepitone, Julianne (September 22, 2010). "Forbes 400: The super-rich get richer". CNN. Retrieved August 11, 2013.
- Bruenig, Matt (March 24, 2014). "You call this a meritocracy? How rich inheritance is poisoning the American economy". Salon. Retrieved August 24, 2014.
- Staff (March 18, 2014). "Inequality – Inherited wealth". The Economist. Retrieved August 24, 2014.
- Pizzigati, Sam (September 24, 2012). "The 'Self-Made' Hallucination of America's Rich". Institute for Policy Studies. Retrieved August 24, 2014.
- "Household wealth inequality statistics from the Federal Reserve". Federal Reserve. March 18, 2020.
- Weissmann, Jordan (March 11, 2013). "Yes, U.S. Wealth Inequality Is Terrible by Global Standards". The Atlantic. Retrieved March 16, 2013.
- Peter Baldwin (2009). The narcissism of minor differences: how America and Europe are alike. Oxford University Press. ISBN 978-0-19-539120-6
- Tax evasion is a national pastime afflicting southern Europe. Archived February 29, 2012, at the Wayback Machine CNN. November 2, 2011
- Low-Income Italians Own An Awful Lot Of Supercars, Private Jets And Yachts Archived December 12, 2012, at the Wayback Machine. Business Insider. January 12, 2012
- Mark Gongloff (October 14, 2014). Key Inequality Measure The Highest Since The Great Depression. The Huffington Post. Retrieved October 14, 2014.
- Pensions, Social Security, and the Distribution of Wealth by Arthur B. Kennickell and Annika E. Sundén of Board of Governors of the Federal Reserve System
- Bruenig, Matt (October 1, 2017). "Wealth Inequality Is Higher Than Ever". Jacobin. Retrieved July 27, 2018.
- Steverman, Ben (June 16, 2017). "The U.S. Is Where the Rich Are the Richest". Bloomberg. Retrieved October 22, 2017.
Now, those policies and their progeny have helped put 63 percent of America’s private wealth in the hands of U.S. millionaires and billionaires, BCG said. By 2021, their share of the nation’s wealth will rise to an estimated 70 percent.
- Rogers, Taylor Nicole (October 9, 2019). "American billionaires paid less in taxes in 2018 than the working class, analysis shows — and it's another sign that one of the biggest problems in the US is only getting worse". Business Insider. Retrieved February 2, 2020.
- Ingraham, Christopher (October 8, 2019). "For the first time in history, U.S. billionaires paid a lower tax rate than the working class last year". The Washington Post. Retrieved February 2, 2020.
- "Are federal taxes progressive?". Tax Policy Center. Retrieved February 2, 2020.
- Wamhoff, Steve., Gardner, Matthew (April 2019). "Who Pays Taxes in America in 2019?" (PDF). Institute on Taxation and Economic Policy.
- "The Federal Reserve's new distributional financial accounts provide telling data on growing U.S. wealth and income inequality". equitablegrowth.org. August 22, 2019. Retrieved February 17, 2020.
- "He noted a sharp reduction in income inequality in the United States between 1913 and 1948. More specifically, at the beginning of this period, the upper decile of the income distribution (that is, the top 10 percent of US earners) claimed 45–50 percent of annual national income. By the late 1940s, the share of the top decile had decreased to roughly 30–35 percent of national income." Piketty, Thomas. Capital in the Twenty-First Century (Kindle Locations 298–300). Harvard University Press. Kindle Edition.
- While Trump Touts Stock Market, Many Americans Are Left Out of the Conversation. By Danielle Kurtzleben, March 1, 2017. NPR.
- Grusky, page 637
- "U.S. Census Bureau, Housing and Household Economic Statistics Division; Income Overview". December 20, 2005. Retrieved February 10, 2019.
- Keister, p. 65
- "Federal Reserve Bank of Chicago, Savings of Young Parents" (PDF). December 2000. Retrieved February 10, 2019.
- It's the Inequality, Stupid By Dave Gilson and Carolyn Perot in Mother Jones, March/April 2011 Issue
- Who are the 1 percent?, CNNMoney.com, October 29, 2011
- "Tax Data Show Richest 1 Percent Took a Hit in 2008, But Income Remained Highly Concentrated at the Top." Center on Budget and Policy Priorities. Accessed October 2011.
- Top Earners Doubled Share of Nation’s Income, Study Finds The New York Times By Robert Pear, October 25, 2011
- An ordinary Joe, The Economist, June 23, 2012
- The Price of Inequality: How Today's Divided Society Endangers Our Future, Stiglitz, J.E.,(2012) W.W. Norton & Company, ISBN 978-0393088694
- Lowrey, Annie (September 10, 2013). "The Rich Get Richer Through the Recovery".
- The Top 1 Percent - What Jobs Do They Have?. The New York Times January 14, 2012
- Divided We Stand: Why Inequality Keeps Rising. OECD (2011)
- Ives, Irving (2016). Modern Labor Economics: Theory and Public Policy. Routledge.
- The Richest 10% of Americans Now Own 84% of All Stocks. By Rob Wile, December 19, 2017. Money.com.
- Federal Reserve Bulletin. September 2017, Vol. 103, No. 3. See PDF: Changes in U.S. Family Finances from 2013 to 2016: Evidence from the Survey of Consumer Finances. Table 1 (on the left) is taken from page 4 of the PDF. Table 2 (on the right) is taken from page 13. See: Survey of Consumer Finances and more data.
- Rattner, Steven (January 22, 2018). "Opinion - The Market Isn't Bullish for Everyone". The New York Times. Retrieved March 23, 2018.
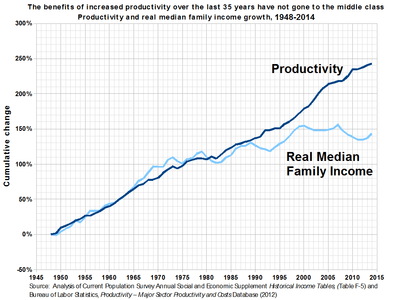
- "Productivity growth closely matched that of median family income until the late 1970s when median American family income stagnated while productivity continued to climb. Chart comparing productivity growth and real median family income growth in the United States from 1947–2009. Source: EPI Authors' analysis of Current Population Survey Annual Social and Economic Supplement Historical Income Tables, (Table F–5) and Bureau of Labor Statistics Productivity – Major Sector Productivity and Costs Database (2012)". Retrieved February 10, 2019.
- "Global wage growth stagnates, lags behind pre-crisis rates, ILO, December 5, 2014". December 5, 2014. Retrieved February 10, 2019.
- "Federal Reserve-Survey of Consumer Finances 2017". Retrieved February 10, 2019.
- Hurst, p. 36
- Grusky, p. 640
- Leung, May (January 22, 2015). "The Causes of Economic Inequality". Seven Pillars Institute. Retrieved January 14, 2019.
- "Emmanuel Saez-Striking it richer: The evolution of top incomes in the U.S." (PDF). June 30, 2016. Retrieved February 10, 2019.
- Hurst, pp. 34–35
- Berman, Y; Shapira, Y; Ben-Jacob, E (2015). "Modeling the Origin and Possible Control of the Wealth Inequality Surge. PLoS ONE 10(6): e0130181,1". doi:10.1371/journal.pone.013018 (inactive January 22, 2020). Retrieved February 10, 2019. Cite journal requires
|journal=(help) - Zyga L, Model shows how surge in wealth inequality may be reversed, http://phys.org/news/2015-07-surge-wealth-inequality-reversed.html, 2015
- Berman Y, Ben-Jacob E, Shapira Y (2016) The Dynamics of Wealth Inequality and the Effect of Income Distribution. PLoS ONE 11(4): e0154196, http://journals.plos.org/plosone/article?id=10.1371/journal.pone.0154196
- Berman, Y; Peters, O; Adamou, A (2016). "Far from equilibrium: Wealth reallocation in the United States". arXiv:1605.05631 [q-fin.EC].
- Stiglitz, Joseph E. (June 4, 2012). The Price of Inequality: How Today's Divided Society Endangers Our Future (Kindle Locations 1148–1149). Norton. Kindle Edition.
- Thomas Shapiro; Tatjana Meschede; Sam Osoro (February 2013). "The Roots of the Widening Racial Wealth Gap: Explaining the Black-White Economic Divide" (PDF). Research and Policy Brief. Brandeis University Institute on Assets and Social Policy. Retrieved March 16, 2013.
- Avery, Robert B.; Rendall, Michael S. (2002), Lifetime Inheritances of Three Generations of Whites and Blacks, 107, The University of Chicago Press
- Keister, Lisa A. (2004). "Race, Family Structure, and Wealth: The Effect of Childhood Family on Adult Asset Ownership" (PDF). Sociological Perspectives. 47 (2): 161–87. doi:10.1525/sop.2004.47.2.161.
- "Wealth inequality has widened along racial, ethnic lines since end of Great Recession" (PDF).
- Oligarchy, not democracy: Americans have ‘near-zero’ input on policy – report. RT, April 15, 2014.
- Martin Gilens & Benjamin I. Page (2014). "Testing Theories of American Politics: Elites, Interest Groups, and Average Citizens" (PDF). Perspectives on Politics. 12 (3): 564–581. doi:10.1017/S1537592714001595.
- "'Corruption is Legal in America' by RepresentUs".
- John Nichols (May 7, 2014). Bernie Sanders Asks Fed Chair Whether the US Is an Oligarchy. The Nation. Retrieved May 8, 2014.
- Piketty, Thomas (2014). Capital in the Twenty-First Century. Belknap Press. ISBN 067443000X pp. 26, 514
- Conley, Julia (March 20, 2019). "Social Democratic Nations Rank Happiest on Global Index (Again). US Ranking Falls (Again)". Common Dreams. Retrieved March 31, 2019.
- "FRED Chart - Wealth inequality by wealth group 1989-Present". fred.stlouisfed.org. March 9, 2020.
- "Sanders Proposes Wealth Tax; Piketty, Reich Applaud-September 6, 2014".
- "Saez & Zucman-Scoring of the Warren Wealth Tax Proposal-January 18, 2019" (PDF).
- "The Budget and Economic Outlook: 2019 to 2029 - Congressional Budget Office". www.cbo.gov.
- "NYT-Associated Press-Billionaires Hit Warren on Proposed Tax Hike on Top Earners-January 29, 2019".
- Krugman, Paul (January 28, 2019). "Opinion - Elizabeth Warren Does Teddy Roosevelt". The New York Times.
- Schumer, Chuck; Sanders, Bernie (February 3, 2019). "Opinion - Schumer and Sanders: Limit Corporate Stock Buybacks". The New York Times.
Further reading
- Alexandra Thornton and Galen Hendricks, Ending Special Tax Treatment for the Very Wealthy, Center for American Progress, June 4, 2019. The report summarizes the problem (gross inequality) and its cause ("special tax treatment for the [extremely rich]"), and specific "ways to rebalance the tax code and put the economy on a better track."
- Moritz Kuhn, Moritz Schularick, and Ulrike I. Steins. 2020. "Income and Wealth Inequality in America, 1949–2016." Journal of Political Economy.
External links
- Wealth Inequality in the United States Since 1913: Evidence from Capitalized Income Tax Data. (Emmanuel Saez and Gabriel Zucman, National Bureau of Economic Research - October 2014.)
- "Wealth Gap" - A Guide (AP News - January 2014).
- State of the Union: Essential Inequality Reader. (Moyers & Company - December 23, 2013).
- Americans Underestimate U.S. Wealth Inequality (Audio - NPR).
- The United States of Inequality (10-part Visual Guide - Slate magazine).
- 15 Mind-Blowing Facts About Wealth And Inequality In America (Charts - The Business Insider).
- It's the Inequality, Stupid: 11 Charts that Explain Everything that's Wrong with America (Mother Jones - March 2011).
- America's Disappearing Middle Class: Implications for Public Policy and Politics (Trevor Beltz - May 2012).
- Wealth Inequality in America (Video).
- Nine Charts about Wealth Inequality in America (April 2015), The Urban Institute
- What Happened to America’s Wealth? The Rich Hid It. Moyers & Company. July 7, 2017
- Wealth Inequality Is Higher Than Ever. Jacobin. October 1, 2017.
- Income and Wealth by Percentiles