Rostock – Landkreis Rostock II
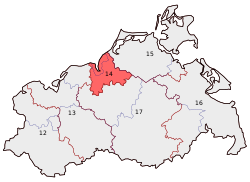
Rostock – Landkreis Rostock II is one of 299 single member constituencies used by the German parliament, the Bundestag. One of six districts covering the state of Mecklenburg-Vorpommern, the constituency covers the city of Rostock and the north-eastern half of the district that bears the same name. The constituency elects one representative under the mixed member proportional representation (MMP) system. Under the current constituency numbering system, it is designated as constituency 14.
The constituency was created for the 1990 election, the first election in a unified Germany.
Developments from 1990 to 2013
Constituency results
| Year | Candidate | Party | First vote |
|---|---|---|---|
| 2013 | Peter Stein | CDU | 35.1% |
| 2009 | Steffen Bockhahn | LINKE | 32.3% |
| 2005 | Christian Kleiminger | SDP | 37.7% |
| 2002 | Christine Lucyga | SDP | 45.2% |
| 1998 | Christine Lucyga | SDP | 36.8% |
| 1994 | Christine Lucyga | SDP | 33.2% |
| 1990 | Christine Lucyga | SDP | 34.4% |
Detailed results
2013 federal election
223,551 residents were eligible to vote, with 152,870 people voting. This was a turnout of 68.3%.
| Party | Constituency results | List results | ||||||
|---|---|---|---|---|---|---|---|---|
| Candidate | Votes | % share | +/- | Votes | % share | +/- | ||
| Christian Democratic Union | Peter Stein | 52,661 | 35.1 | +8.2 | 57,188 | 37.9 | +10.9 | |
| The Left | Steffen Bockhahn | 46,160 | 30.7 | -1.6 | 35,792 | 23.7 | -7.4 | |
| Social Democratic Party of Germany | Christian Kleiminger | 27,498 | 18.3 | -1.3 | 29,010 | 19.2 | +1.2 | |
| Alliance '90/The Greens | Harald Terpe | 11,216 | 7.5 | -3.2 | 9,874 | 6.5 | -1.9 | |
| National Democratic Party | Normen Schreiter | 3,308 | 2.2 | -0.3 | 2,484 | 1.6 | -0.7 | |
| Pirate Party | Michael Slobidnyk | 3,263 | 2.2 | ‒ | 3,588 | 2.4 | -0.9 | |
| Free Democratic Party | Hagen Reinhold | 1,606 | 1.1 | -5.5 | 2,911 | 1.9 | -7.6 | |
| N/A | Free Voters | Klaus-Dieter Gabbert | 1,385 | 0.9 | ‒ | 1,109 | 0.7 | ‒ |
| Marxist-Leninist Party of Germany | Renate Voß | 545 | 0.4 | / | 292 | 0.2 | -0.1 | |
| Alternative for Germany | ‒ | ‒ | ‒ | ‒ | 8,196 | 5.4 | ‒ | |
| N/A | Pro Germany Citizens' Movement | ‒ | ‒ | ‒ | ‒ | 224 | 0.1 | ‒ |
| The Republicans | ‒ | ‒ | ‒ | ‒ | 106 | 0.1 | / | |
| Independent | Steffen Wiechmann | 2,509 | 1.7 | ‒ | ‒ | ‒ | ‒ | |
2009 federal election
198,527 residents were eligible to vote, with 130,659 people voting. This was a turnout of 65.8%.[2]
| Party | Constituency results | List results | ||||||
|---|---|---|---|---|---|---|---|---|
| Candidate | Votes | % share | +/- | Votes | % share | +/- | ||
| The Left | Steffen Bockhahn | 41,539 | 32.3 | +10.0 | 40,045 | 31.1 | +7.2 | |
| Christian Democratic Union | Peter Stein | 34,517 | 26.9 | +1.3 | 34,759 | 27.0 | +4.2 | |
| Social Democratic Party of Germany | Christian Kleiminger | 25,389 | 19.8 | -17.9 | 23,233 | 18.0 | -20.9 | |
| Alliance '90/The Greens | Harald Terpe | 13,727 | 10.7 | +1.3 | 10,772 | 8.4 | +2.9 | |
| Free Democratic Party | Hagen Reinhold | 8,517 | 6.6 | +2.5 | 12,234 | 9.5 | +4.1 | |
| National Democratic Party | Franziska Vorpahl | 3,215 | 2.5 | ‒ | 2,999 | 2.3 | +0.3 | |
| Marxist-Leninist Party of Germany | Renate Voß | 554 | 0.4 | -0.4 | 324 | 0.3 | -0.2 | |
| Pirate Party | ‒ | ‒ | ‒ | ‒ | 4,215 | 3.3 | ‒ | |
| The Republicans | ‒ | ‒ | ‒ | ‒ | 177 | 0.1 | ‒ | |
| Independent | Hartmut Rusin | 565 | 0.4 | ‒ | ‒ | ‒ | ‒ | |
| Independent | Gabriele Radloff | 479 | 0.4 | ‒ | ‒ | ‒ | ‒ | |
References
- "Wahl zum Bundestag der Bundesrepublik Deutschland in Mecklenburg-Vorpommern am 22. September 2013" (in German). Retrieved 22 July 2016.
- "Wahlkreisergebnis Bundesland Mecklenburg-Vorpommern Wahlkreis 014 - Rostock" (in German). Retrieved 27 July 2016.