Net international investment position
The Net international investment position (NIIP) is the difference between the external financial assets and liabilities of a country.[1] External debt of a country includes government debt and private debt. Publicly and privately held external assets by a country's legal residents are also taken into account when calculating its NIIP.[2] Please note that commodities and currencies tend to follow a cyclical pattern by undergoing significant valuation changes, which is also reflected in NIIP.
The International investment position (IIP) of a country is a financial statement of the value and composition of its external financial assets and liabilities. A positive NIIP value indicates that a nation is a creditor nation, while a negative value indicates that it is a debtor nation.
History
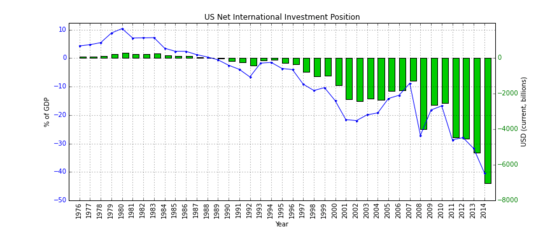
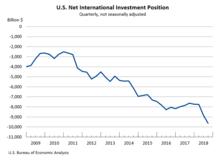
The US was the world's largest creditor until the 1960s. However, over the last few decades, the US has become the world's largest debtor. Since the 1980s, Japan replaced the USA as the world's largest creditor nation. With the ascent of the Hong Kong Monetary Authority's credit position since 2015, China (including Hong Kong and Macau) and Japan have been competing for the top creditor position.
List of countries and regions by net international investment position
| Countries and regions | Date | GDP[3]
(US$MM) |
Date | NIIP[4]
(US$MM) |
Date | NIIP
(%GDP) |
|---|---|---|---|---|---|---|
| 2019 | 15,418 | 2020Q1 | -7,621 | 2019 | −52.1 | |
| 2019 | 445,469 | 2020Q1 | +121,506 | 2019 | 26.3 | |
| 2019 | 13,444 | 2020Q1 | -9,793 | 2019 | −73.1 | |
| 2019 | 1,376,255[5] | 2020Q1 | -498,994 | 2019 | −45.5 | |
| 2019 | 447,718 | 2020Q1 | +66,632 | 2019 | 9.6[6] | |
| 2019 | 317,465 | 2019 | -39,401 | 2019 | −12.4 | |
| 2019 | 2,842 | 2019 | -2,644 | 2019 | −93.0 | |
| 2019 | 1,847,020 | 2020Q1 | -362,505 | 2019 | −39.6 | |
| 2019 | 62,572 | 2020Q1 | -32,488 | 2019 | −51.2 | |
| 2019 | 517,609 | 2020Q1 | +199,098 | 2019 | 47.2[6] | |
| 2019 | 66,250 | 2020Q1 | -20,606 | 2019 | −31.6[6] | |
| 2019 | 26,730 | 2020Q1 | -22,254 | 2019 | −98.5 | |
| 2019 | 1,730,914 | 2020Q1 | +658,507 | 2019 | 44.5 | |
| 2019 | 294,237 | 2020Q1 | -45,531 | 2018 | −23.6 | |
| 2019 | 48,994 | 2018 | -19,779 | 2018 | −42.0 | |
| 2019 | 327,895 | 2020Q1 | -157,132 | 2019 | −51.7 | |
| 2019 | 14,140,163 | 2020Q1 | +2,137,266 | 2019 | 15.0 | |
| 2019 | 60,702 | 2020Q1 | -29,435 | 2019 | −51.0[6] | |
| 2019 | 24,280 | 2020Q1 | -27,765 | 2019 | −116.0[6] | |
| 2019 | 246,953 | 2020Q1 | -31,593 | 2019 | −20.7[6] | |
| 2019 | 347,176 | 2019 | +271,675 | 2019 | 78.1[6] | |
| 2019 | 302,256 | 2019 | -188,020 | 2019 | −62.2 | |
| 2019 | 31,038 | 2020Q1 | -6,992 | 2019 | −19.7[6] | |
| 2019 | 269,654 | 2020Q1 | -97 | 2019 | 1.7[6] | |
| 2019 | 2,707,074 | 2020Q1 | -577,024 | 2019 | −23.3[6] | |
| 2019 | 3,863,344 | 2020Q1 | +2,580,708 | 2019 | 71.2[6] | |
| 2019 | 214,012 | 2020Q1 | -310,649 | 2019 | −150.6[6] | |
| 2019 | 372,989 | 2020Q1 | +1,562,238 | 2019 | 419.1 | |
| 2019 | 170,407 | 2020Q1 | -65,415 | 2019 | −47.9[6] | |
| 2019 | 23,918 | 2020Q1 | +4,882 | 2019(Q1) | 21[7] | |
| 2019 | 2,935,570 | 2020Q1 | -383,371 | Dec. 2019 | −15.9[8] | |
| 2019 | 1,111,713 | 2020Q1 | −253,708 | 2019 | −30.4 | |
| 2019 | 384,940 | 2019 | -671,100 | 2019 | −172.0[6] | |
| 2019 | 387,717 | 2020Q1 | +153,015 | 2019 | 41.0 | |
| 2019 | 1,988,636 | 2020Q1 | -71,407 | 2019 | −1.7[6] | |
| 2019 | 5,154,475 | 2020Q1 | +3,453,557 | 2019 | 66.6 | |
| 2019 | 170,326 | 2020Q1 | -60,230 | 2019 | −36.2 | |
| 2019 | 137,591 | 2019 | +115,211 | 2019 | 83.7 | |
| 2019 | 35,045 | 2020Q1 | -14,861 | 2019 | −44.1[6] | |
| 2019 | 53,641 | 2020Q1 | -12,367 | 2019 | −23.7[6] | |
| 2019 | 69,453 | 2020Q1 | +31,284 | 2019 | 50.9[6] | |
| 2019 | 365,303 | 2018 | -18,761 | 2018 | −5.2 | |
| 2019 | 14,859 | 2019 | +9,003 | 2019 | 62.7[6] | |
| 2019 | 1,274,175 | 2020Q1 | -522,871 | 2019 | −51.4 | |
| 2019 | 13,637 | 2020Q1 | -35,677 | 2019 | −262.8 | |
| 2019 | 5,424 | 2018 | -9,044 | 2018 | −178.8 | |
| 2019 | 15,093 | 2018 | -52,581 | 2018 | −365.2 | |
| 2019 | 902,355 | 2020Q1 | +888,921 | 2019 | 89.2[6] | |
| 2019 | 204,671 | 2020Q1 | -109,166 | 2019 | −56.2 | |
| 2019 | 12,528 | 2018 | -16,921 | 2018 | −129.0 | |
| 2019 | 446,543 | 2018 | -82,598 | 2018 | −20.7 | |
| 2019 | 417,627 | 2020Q1 | +839,941 | 2019 | 238.6 | |
| 2019 | 284,214 | 2019 | -125,363 | 2019 | −44.1 | |
| 2019 | 68,536 | 2019 | -65,998 | 2019 | −96.3 | |
| 2019 | 228,989 | 2018 | -84,332 | 2018 | −37.4 | |
| 2019 | 356,814 | 2020Q1 | -9,837 | 2019 | −9.8 | |
| 2019 | 565,854 | 2020Q1 | -257,781 | 2019 | −50.0[6] | |
| 2019 | 236,408 | 2020Q1 | -232,561 | 2019 | −100.8[6] | |
| 2019 | 243,698 | 2020Q1 | -99,592 | 2019 | −43.4[6] | |
| 2019 | 1,637,892 | 2020Q1 | +523,603 | 2019 | 21.8 | |
| 2019 | 779,289 | 2020Q1 | +656,158 | 2019 | 87.6 | |
| 2019 | 51,523 | 2020Q1 | -45,611 | 2019 | −88.5 | |
| 2019 | 362,818 | 2020Q1 | +867,419 | 2019 | 247.0 | |
| 2019 | 106,552 | 2020Q1 | -68,984 | 2019 | −65.5[6] | |
| 2019 | 54,154 | 2020Q1 | -8,855 | 2019 | −19.3[6] | |
| 2019 | 358,839 | 2020Q1 | +87,962 | 2019 | 8.0 | |
| 2019 | 1,629,532 | 2020Q1 | +565,066 | 2019 | 30.7 | |
| 2019 | 1,397,870 | 2020Q1 | -970,410 | 2019 | −74.0[6] | |
| 2019 | 30,873 | 2018 | -85,180 | 2018 | −248.5 | |
| 2019 | 528,929 | 2020Q1 | +78,052 | 2019 | 20.9[6] | |
| 2019 | 715,360 | 2020Q1 | +772,676 | 2019 | 117.2 | |
| 2019 | 586,104 | 2019 | +1,342,780[9] | 2019 | 229.1 | |
| 2019 | 529,177 | 2020Q1 | +68,959 | 2019 | −1.8 | |
| 2019 | 38,732 | 2018 | -57,117 | 2018 | −143.2 | |
| 2019 | 743,708 | 2020Q1 | -314,870 | 2019 | −47.3 | |
| 2019 | 30,666 | 2019 | -18,640 | 2019 | −60.8 | |
| 2019 | 150,401 | 2019 | -20,737 | 2019 | −13.8 | |
| 2019 | 2,743,586 | 2020Q1 | -478,212 | 2019 | −25.2[6] | |
| 2020Q1 | 21,540,000[10] | 2020Q1 | -12,057,462 | 2020Q1 | −56.0 | |
| 2019 | 23,946 | 2019 | -27,893 | 2019 | −116.5 | |
See also
- Net foreign assets
- List of countries by external debt
- List of countries by public debt
- List of countries by net international investment position per capita (disambiguation)
References
- Bivens, L. Josh (December 14, 2004). "Debt and the dollar: The United States damages future living standards by borrowing itself into a deceptively deep hole". Epinet.org. Archived from the original on January 20, 2008. Retrieved 2009-06-28.
- Ministry of Economic and Finance of Argentina International Investment Position Methodology page.1
- April 2020 "Report for Selected Country Groups and Subjects" Check
|url=value (help). International Monetary Fund. - "IMF Data". data.imf.org. Retrieved 26 June 2020.
- "World Economic Outlook Database, October 2019". IMF.org. International Monetary Fund. Retrieved 16 October 2019.
- "Net international investment position in % of GDP - annual data; code: tipsii10". Eurostat. Retrieved 6 May 2020.
- Central Bank of Iceland
- "Reserve Bank of India - Press Releases". www.rbi.org.in. Retrieved 2019-09-04.
- Central Bank of the Republic of China (Taiwan)
- "Gross Domestic Product, 1st Quarter 2020 (Third Estimate)", Bureau of Economic Analysis.
External links
- Bureau of Economic Analysis Elena L. Nguyen: The International Investment Position of the United States at Yearend 2007. U.S.
- Bank of Japan Japan’s International Investment Position at Year-End 2009 (Retrieved on June 30, 2011)
- Deutsche Bundesbank (German Central Bank) International Investment Position - External Debt Statistics
- European Economic Forecast Spring 2010 European Commission working draft Graph 1.3.2., International investment position since 1980 in major economic units.
Statistics
- International Monetary Fund (IMF) International Investment Position (IIP) Data
- International Monetary Fund (IMF) World Economic Outlook Database, April 2011
- UK National Statistics Great Britain: International Investment Position, Table K
- Saint-Petersburg (Russia) statistic Economic statistics of St. Petersburg