Motor vehicle fatality rate in U.S. by year
The table below shows the motor vehicle fatality rate in the United States by year from 1899 through 2018. It excludes indirect car-related fatalities.
For 2016 specifically, National Highway Traffic Safety Administration (NHTSA) data shows 37,461 people were killed in 34,436 motor vehicle crashes, an average of 102 per day.[1]
In 2010, there were an estimated 5,419,000 crashes, 30,296 deadly, killing 32,999, and injuring 2,239,000.[2] About 2,000 children under 16 die every year in traffic collisions.[3] Records indicate that there were 3,613,732 motor vehicle fatalities in the United States from 1899 to 2013.
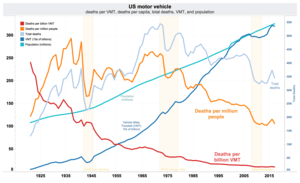
Although the number of deaths, and deaths relative to the total US population, declined over most of the previous two decades, the trend reversed in 2015 and continued to move upward in 2016. From 1979 to 2005, the number of deaths per year decreased 14.97% while the number of deaths per capita decreased by 35.46%. The 32,479 traffic fatalities in 2011 were the lowest in 62 years, since 1949. US motor death statistics reported by government only include those on public roads, and do not include parking lots, driveways, and private roads.[4]
Motor vehicle deaths in U.S. by year
| Year | Deaths | VMT– Vehicle miles traveled (billions) | Fatalities per 100 million VMT | Population | Fatalities per 100,000 population | Change in per capita fatalities from previous year |
|---|---|---|---|---|---|---|
| 1899 | 26[5] | |||||
| 1900 | 36 | 76,094,000 | 0.05 | NA | ||
| 1901 | 54 | 77,584,000 | 0.07 | |||
| 1902 | 79 | 79,163,000 | 0.10 | |||
| 1903 | 117 | 80,632,000 | 0.15 | |||
| 1904 | 172 | 82,166,000 | 0.21 | |||
| 1905 | 252 | 83,822,000 | 0.30 | |||
| 1906 | 338 | 85,450,000 | 0.40 | |||
| 1907 | 581 | 87,008,000 | 0.67 | |||
| 1908 | 751 | 88,710,000 | 0.85 | |||
| 1909 | 1,174 | 90,490,000 | 1.30 | |||
| 1910 | 1,599 | 92,407,000 | 1.73 | |||
| 1911 | 2,043 | 93,863,000 | 2.18 | |||
| 1912 | 2,968 | 95,335,000 | 3.11 | |||
| 1913 | 4,079 | 97,225,000 | 4.20 | |||
| 1914 | 4,468 | 99,111,000 | 4.51 | |||
| 1915 | 6,779 | 100,546,000 | 6.74 | |||
| 1916 | 7,766 | 101,961,000 | 7.62 | |||
| 1917 | 9,630 | 103,268,000 | 9.33 | |||
| 1918 | 10,390 | 103,208,000 | 10.07 | |||
| 1919 | 10,896 | 104,514,000 | 10.42 | |||
| 1920 | 12,155 | 106,461,000 | 11.42 | |||
| 1921 | 13,253 | 55 | 24.09 | 108,538,000 | 12.21 | |
| 1922 | 14,859 | 67 | 21.95 | 110,049,000 | 13.50 | |
| 1923 | 17,870 | 85 | 21.03 | 111,947,000 | 15.96 | |
| 1924 | 18,400 | 104 | 17.55 | 114,109,000 | 16.13 | |
| 1925 | 20,771 | 122 | 16.98 | 115,829,000 | 17.93 | |
| 1926 | 22,194 | 140 | 15.77 | 117,397,000 | 18.91 | |
| 1927 | 24,470 | 158 | 15.44 | 119,035,000 | 20.56 | |
| 1928 | 26,557 | 172 | 15.36 | 120,509,000 | 22.04 | |
| 1929 | 29,592 | 197 | 14.97 | 121,767,000 | 24.30 | |
| 1930 | 31,204 | 206 | 15.12 | 123,076,741 | 25.35 | |
| 1931 | 31,963 | 216 | 14.79 | 124,039,648 | 25.77 | |
| 1932 | 27,979 | 200 | 13.95 | 124,840,471 | 22.41 | |
| 1933 | 29,746 | 200 | 14.83 | 125,578,763 | 23.69 | |
| 1934 | 34,240 | 215 | 15.88 | 126,373,773 | 27.09 | |
| 1935 | 34,494 | 228 | 15.09 | 127,250,232 | 27.11 | |
| 1936 | 36,126 | 252 | 14.33 | 128,053,180 | 28.21 | |
| 1937 | 37,819 | 270 | 14.00 | 128,824,829 | 29.36 | |
| 1938 | 31,083 | 271 | 11.46 | 129,824,939 | 23.94 | |
| 1939 | 30,895 | 285 | 10.83 | 130,879,718 | 23.61 | |
| 1940 | 32,914 | 302 | 10.89 | 132,122,446 | 24.91 | |
| 1941 | 38,142 | 333 | 11.43 | 133,402,471 | 28.59 | |
| 1942 | 27,007 | 268 | 10.07 | 134,859,553 | 20.03 | |
| 1943 | 22,727 | 208 | 10.92 | 136,739,353 | 16.62 | |
| 1944 | 23,165 | 212 | 10.89 | 138,397,345 | 16.74 | |
| 1945 | 26,785 | 250 | 10.71 | 139,928,165 | 19.14 | |
| 1946 | 31,874 | 340 | 9.35 | 141,388,566 | 22.54 | |
| 1947 | 31,193 | 370 | 8.41 | 144,126,071 | 21.64 | |
| 1948 | 30,775 | 397 | 7.73 | 146,631,302 | 21.00 | |
| 1949 | 30,246 | 424 | 7.13 | 149,188,130 | 20.27 | |
| 1950 | 33,186 | 458 | 7.24 | 152,271,417 | 21.79 | |
| 1951 | 35,309 | 491 | 7.19 | 154,877,889 | 22.80 | |
| 1952 | 36,088 | 513 | 7.03 | 157,552,740 | 22.91 | |
| 1953 | 36,190 | 544 | 6.65 | 160,184,192 | 22.59 | |
| 1954 | 33,890 | 561 | 6.03 | 163,025,854 | 20.79 | |
| 1955 | 36,688 | 605 | 6.06 | 165,931,202 | 22.11 | |
| 1956 | 37,965 | 627 | 6.05 | 168,903,031 | 22.48 | |
| 1957 | 36,932 | 647 | 5.71 | 171,984,130 | 21.47 | |
| 1958 | 35,331 | 664 | 5.32 | 174,881,904 | 20.20 | |
| 1959 | 36,223 | 700 | 5.17 | 177,829,628 | 20.37 | |
| 1960 | 36,399 | 718 | 5.06 | 180,671,158 | 20.15 | |
| 1961 | 36,285 | 737 | 4.92 | 183,691,481 | 19.75 | |
| 1962 | 38,980 | 766 | 5.08 | 186,537,737 | 20.90 | |
| 1963 | 41,723 | 805 | 5.18 | 189,241,798 | 22.05 | |
| 1964 | 45,645 | 846 | 5.39 | 191,888,791 | 23.79 | |
| 1965 | 47,089 | 887 | 5.30 | 194,302,963 | 24.24 | |
| 1966 | 50,894 | 925 | 5.50 | 196,560,338 | 25.89 | |
| 1967 | 50,724 | 964 | 5.26 | 198,712,056 | 25.53 | |
| 1968 | 52,725 | 1,015 | 5.19 | 200,706,052 | 26.27 | |
| 1969 | 53,543 | 1,061 | 5.04 | 202,676,946 | 26.42 | |
| 1970 | 52,627 | 1,109 | 4.74 | 205,052,174 | 25.67 | |
| 1971 | 52,542 | 1,178 | 4.46 | 207,660,677 | 25.30 | |
| 1972 | 54,589 | 1,259 | 4.33 | 209,896,021 | 26.01 | |
| 1973 | 54,052 | 1,313 | 4.12 | 211,908,788 | 25.51 | |
| 1974 | 45,196 | 1,280 | 3.53 | 213,853,928 | 21.13 | |
| 1975 | 44,525 | 1,327 | 3.35 | 215,973,199 | 20.62 | |
| 1976 | 45,523 | 1,402 | 3.25 | 218,035,164 | 20.88 | |
| 1977 | 47,878 | 1,467 | 3.26 | 220,239,425 | 21.74 | |
| 1978 | 50,331 | 1,544 | 3.26 | 222,584,545 | 22.61 | |
| 1979 | 51,093 | 1,529 | 3.34 | 225,055,487 | 22.70 | |
| 1980 | 51,091 | 1,527 | 3.35 | 227,224,681 | 22.48 | |
| 1981 | 49,301 | 1,552 | 3.18 | 229,465,714 | 21.49 | |
| 1982 | 43,945 | 1,595 | 2.76 | 231,664,458 | 18.97 | |
| 1983 | 42,589 | 1,652 | 2.58 | 233,791,994 | 18.22 | |
| 1984 | 44,257 | 1,720 | 2.57 | 235,824,902 | 18.77 | |
| 1985 | 43,825 | 1,774 | 2.47 | 237,923,795 | 18.42 | |
| 1986 | 46,087 | 1,834 | 2.51 | 240,132,887 | 19.19 | |
| 1987 | 46,390 | 1,921 | 2.42 | 242,288,918 | 19.15 | |
| 1988 | 47,087 | 2,025 | 2.32 | 244,498,982 | 19.26 | |
| 1989 | 45,582 | 2,096 | 2.17 | 246,819,230 | 18.47 | |
| 1990 | 44,599 | 2,144 | 2.08 | 249,464,396 | 17.88 | |
| 1991 | 41,508 | 2,172 | 1.91 | 252,153,092 | 16.46 | |
| 1992 | 39,250 | 2,247 | 1.75 | 255,029,699 | 15.39 | |
| 1993 | 40,150 | 2,296 | 1.75 | 257,782,608 | 15.58 | |
| 1994 | 40,716 | 2,358 | 1.73 | 260,327,021 | 15.64 | |
| 1995 | 41,817 | 2,423 | 1.73 | 262,803,276 | 15.91 | |
| 1996 | 42,065 | 2,486 | 1.69 | 265,228,572 | 15.86 | |
| 1997 | 42,013 | 2,562 | 1.64 | 267,783,607 | 15.69 | |
| 1998 | 41,501 | 2,632 | 1.58 | 270,248,003 | 15.36 | |
| 1999 | 41,717 | 2,691 | 1.55 | 272,690,813 | 15.30 | |
| 2000 | 41,945 | 2,747 | 1.53 | 282,216,952 | 14.86 | |
| 2001[2] | 42,196 | 2,797 | 1.51 | 285,226,284 | 14.79 | |
| 2002 | 43,005 | 2,856 | 1.51 | 288,125,973 | 14.93 | |
| 2003 | 42,884 | 2,890 | 1.48 | 290,796,023 | 14.75 | |
| 2004 | 42,836 | 2,965 | 1.44 | 293,638,158 | 14.59 | |
| 2005 | 43,510 | 2,989 | 1.46 | 296,507,061 | 14.67 | |
| 2006 | 42,708 | 3,014 | 1.42 | 299,398,484 | 14.27 | |
| 2007 | 41,259 | 3,031 | 1.36 | 301,139,947 | 13.70 | |
| 2008 | 37,423 | 2,977 | 1.26 | 303,824,640 | 12.32 | |
| 2009 | 33,883 | 2,957 | 1.15 | 306,700,000 | 11.05 | |
| 2010[2] | 32,999 | 2,967 | 1.11 | 309,326,000 | 10.67 | |
| 2011[6] | 32,479 | 2,950 | 1.10 | 311,588,000 | 10.42 | |
| 2012[7] | 33,782 | 2,969 | 1.14 | 313,914,000 | 10.75 | |
| 2013 | 32,893 | 2,988 | 1.10 | 316,129,000 | 10.40 | |
| 2014 | 32,744 | 3,026 | 1.08 | 318,860,000 | 10.28 | |
| 2015 | 35,485 | 3,095 | 1.15 | 321,370,000 | 11.06 | |
| 2016[8] | 37,806 | 3,174 | 1.19 | 323,121,000 | 11.59 | |
| 2017[8] | 37,133 | 3,213 | 1.16 | 326,213,213 | 11.40 | |
| 2018[9][10] | 36,560 | 3,223 | 1.13 | 327,096,265 | 11.18 |
2010 detailed statistics
The following table summarizes the number of people killed and injured in fatal collisions by month in 2010. The table does not include injuries resulting from incidents in which no fatalities occurred.[11]
| Month | Fatalities | In-vehicle casualties (excluding uninjured bus occupants) | Non-vehicle casualties (including pedestrians) |
|---|---|---|---|
| Jan | 2290 | 4785 | 427 |
| Feb | 2016 | 4340 | 386 |
| Mar | 2423 | 5087 | 407 |
| Apr | 2777 | 5775 | 404 |
| May | 2934 | 6066 | 419 |
| Jun | 2795 | 5809 | 348 |
| Jul | 3095 | 6763 | 456 |
| Aug | 3083 | 6549 | 428 |
| Sep | 3024 | 6309 | 511 |
| Oct | 3056 | 6382 | 543 |
| Nov | 2795 | 5842 | 573 |
| Dec | 2597 | 5417 | 548 |
These fatalities do not include those also attributable to transportation-linked pollution nor to energy production for the use of the transportation. They are also only human fatalities, while animals are also significantly affected, with tens of millions of deaths.[12] Another factor not included in this tally is that attributable to traffic noise, which could be millions as a contributory factor and is likely to be tens of thousands as a direct consequence.[13]
Pedestrians
Pedestrian deaths are included in above totals. These deaths had been falling from 6,482 in 1990 to 4,109 in 2009. The number began rising in 2010, and exceeded 6,000 by 2018. Proportionately, pedestrians comprised 12% of all traffic deaths in 2008, rising to 16% in 2017. A report by the Governors Highway Safety Association said most of the increases in deaths occurred at night, as well as suggesting several other potential explanations for the rise, including changes in economics, such as fuel prices, and changes in weather and demographics, along with increases in population, vehicle miles traveled, and time spent walking. The shift away from passenger cars to light duty trucks, particularity the popularity of SUVs, also coincided with the increase, and light truck impacts cause worse pedestrian injuries. An increase in driver smartphone distraction is also a possible factor, with the number of phones in use increasing by a factor of five from 2010 to 2017.[14] Some 6,227 pedestrians were killed in traffic in 2018 in the US.[15] Around 3000 additional people are killed each year in parking lots, driveways, or private roads, many of whom are pedestrians[16] who are not counted in these fatality statistics.

Motorcyclists

See also
- Cyclist fatality rate in U.S. by year
- Effects of the car on societies
- List of countries by traffic-related death rate
- List of motor vehicle deaths in Iceland by year
- List of motor vehicle deaths in Japan by year
- List of motor vehicle deaths in Thailand by year
- Work-related road safety in the United States
- Transportation safety in the United States
References
- https://crashstats.nhtsa.dot.gov/Api/Public/ViewPublication/812451
- 'Fatality Analysis Reporting System' 2010, fars.NHTSA.dot.gov Retrieved July 3, 2014
- Dow Chang. "Comparison of Crash Fatalities by Sex and Age Group". nhtsa.dot.gov.
- http://www.sfgate.com/news/medical/article/2016-traffic-deaths-jump-to-highest-level-in-10934306.php
- "U.S. Highway Deaths Decline 2.9%, Falling for Fifth Year". Bloomberg. December 8, 2011.
- 'Fatality Analysis Reporting System' 2011, fars.NHTSA.dot.gov Retrieved July 3, 2014
- "NHTSA Quick Facts 2014". National Highway Traffic Safety Administration. 2014. Retrieved 13 July 2020.
- https://crashstats.nhtsa.dot.gov/Api/Public/ViewPublication/812603
- "2018 Fatal Motor Vehicle Crashes: Overview". National Highway Traffic Safety Administration. October 2019. Retrieved 13 July 2020.
- "U.S. pedestrian, bicyclist deaths rise in 2018: report". Reuters. 2019-06-17. Retrieved 2019-06-18.
- "FARS 2010". National Highway Transportation Safety Administration.
- "More Animals Are Killed By Cars Each Day Than We Ever Could Have Imagined". the dodo. Retrieved 2018-07-02.
- "Sonic doom: how noise pollution kills thousands each year". the Guardian. Retrieved 2018-07-02.
- Retting, Richard; Sam Schwartz Consulting (February 2019), Macek, Kara (ed.), Pedestrian Traffic Fatalities by State 2018 Preliminary Data (PDF), Governors Highway Safety Association
- LeBeau, Phil (February 28, 2019), "Pedestrian deaths hit 28-year high, and big vehicles and smartphones are to blame", CNBC
- Bomey, Nathan (February 15, 2018), "U.S. vehicle deaths topped 40,000 in 2017, National Safety Council estimates", USA Today
External links
- Fatality Analysis Reporting System (FARS) at NHTSA
- "Motor Vehicle Traffic Fatalities & Fatality Rate: 1899–2003" (PDF). Safe Roads. 2004. Archived from the original (PDF) on 2011-09-21.
- Badger, Emily; Ingraham, Christopher (Oct 1, 2015). "The hidden inequality of who dies in car crashes". The Washington Post.