List of Chief Ministers of the Australian Capital Territory by time in office
This is a list of chief ministers of the Australian Capital Territory by time in office. The basis of the list is the inclusive number of days between dates.
Rank by time in office
- Parties
Australian Labor Party Liberal Party of Australia
| Rank: | Premier: | Portrait: | Party: | District: | Assumed Office: |
Left Office: |
TERM Time in Office: |
TOTAL Time in Office: |
Election Wins: | |
|---|---|---|---|---|---|---|---|---|---|---|
| 1. | Jon Stanhope (1951–) AO |
 |
Labor | MLA for Ginninderra (1998–2011) |
5 November 2001 | 12 May 2011 | 9 years, 188 days | 2001 2004 2008 | ||
| 2. | Andrew Barr (1973–) |
.jpg) |
Labor | MLA for Molonglo (2006–2016) MLA for Kurrajong (2016- ) |
11 December 2014 | Incumbent | 5 years, 247 days[1] | 2016 | ||
| 3. | Kate Carnell (1955–) AO |
Liberal | MLA for Molonglo (1992–2000) |
2 March 1995 | 18 October 2000 | 5 years, 230 days | 1995 1998 | |||
| 4. | Rosemary Follett (1948–) AO |
Labor | MLA for Molonglo (1995–1996) |
11 May 1989 | 5 December 1989 | 208 days | 4 years, 122 days | 1989 1992 | ||
| 6 June 1991 | 2 March 1995 | 3 years, 330 days | ||||||||
| 5. | Katy Gallagher (1970–) |
 |
Labor | MLA for Molonglo (2001–2014) |
16 May 2011 | 11 December 2014 | 3 years, 209 days | 2012 | ||
| 6. | Trevor Kaine (1928–2008) |
.jpg) |
Liberal | MLA for Brindabella (1995–2001) |
5 December 1989 | 6 June 1991 | 1 year, 183 days | |||
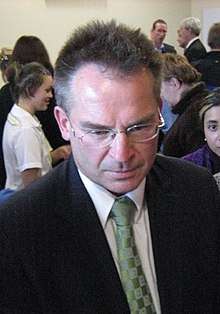
| 7. | Gary Humphries (1958–) |
 |
Liberal | MLA for Molonglo (1995–2002) |
18 October 2000 | 5 November 2001 | 1 year, 18 days |
Total time in office of political parties in Australian Capital Territory
Australian Capital Territory Assembly – 11418 days as of 14 August 2020
Labor
- 8430 days as of 14 August 2020.
Liberal
- 2990 days.
Notes
- Andrew Barr's time in office as of 14 August 2020
See also
- Chief Ministers of the Australian Capital Territory
- List of Australian heads of government by time in office
- List of prime ministers of Australia by time in office
- List of Premiers of New South Wales by time in office
- List of Premiers of Queensland by time in office
- List of Premiers of South Australia by time in office
- List of Premiers of Tasmania by time in office
- List of Premiers of Victoria by time in office
- List of Premiers of Western Australia by time in office
- List of Chief Ministers of the Northern Territory by time in office
This article is issued from Wikipedia. The text is licensed under Creative Commons - Attribution - Sharealike. Additional terms may apply for the media files.