Las Lomitas
Las Lomitas is a city in northern Argentina. It is located in the Patiño Department in the center of Formosa Province.[1] It has a population of 12,399 inhabitants as of the 2010 census [INDEC]. This represented a 20% increase in the population compared to the 2001 census [INDEC] which only had 10,354 inhabitants.[1]
Las Lomitas | |
|---|---|
City | |
 Las Lomitas | |
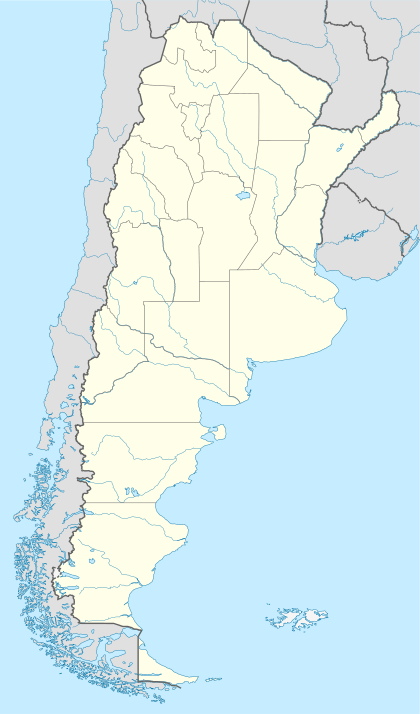
| Coordinates: 24°42′22.6″S 60°35′37.4″W | |
| Country | |
| Province | |
| Department | Patiño Department |
| Established | 20 October 1915 |
| Government | |
| • Intendant | Francisco Gaetan (PJ) |
| Population (2010 census) | |
| • Total | 12,399 |
| Website | Official Website |
It is served by Alférez Armando Rodríguez Airport.
Climate
Las Lomitas has a humid subtropical climate (Köppen climate classification Cwa), similar to other areas in the Chaco region.[2] It is the warmest city in Argentina, with an annual mean temperature of 22.8 °C (73.0 °F).[3] Winters are characterized with mild to warm temperatures during the day and cool nights and are dry.[4] In the coldest month, June, the average high is 23.1 °C (73.6 °F) while the average low is 11.2 °C (52.2 °F).[5] Temperatures can occasionally fall below freezing during cold waves although during heat waves, temperatures can reach above 39 °C (102.2 °F).[4] In an average winter, Las Lomitas receives 8.5 days of frost per year while the first and last dates of frost are 28 June and 29 July respectively.[6][7] Spring and fall are transition seasons and are rather short featuring hot daytime temperatures and mild nighttime temperatures.[4] Frosts are rare in these seasons and temperatures may exceed 40 °C (104.0 °F). Summers are hot, long and very humid, owing to most of the precipitation occurring during this season.[4] In the hottest month, January, the average high is 34.8 °C (94.6 °F) while the average low is 21.7 °C (71.1 °F).[5] During the most extreme heat waves, the temperature can reach above 45 °C (113.0 °F).[7] The average relative humidity is 67%, with the late summer and fall months being more humid than the winter months. On average, Las Lomitas receives 862.5 millimetres (34 in) of precipitation per year with 86 days with measureable precipitation with summer months being more wetter than the winter months, where most of the precipitation falls in the form of thunderstorms.[5][8] Las Lomitas receives approximately 2,717.0 hours of bright sunshine per year or 60% of possible sunshine per year, ranging from a low of 51% in June (only 162.0 hours of sunshine per month) to a high of 68% in February.[5] The highest recorded temperature was 45.6 °C (114.1 °F) on October 16, 2014 while the lowest recorded temperature was −5.9 °C (21.4 °F) on July 19, 1975.[9]
| Climate data for Las Lomitas (1981–2010, extremes 1961–present) | |||||||||||||
|---|---|---|---|---|---|---|---|---|---|---|---|---|---|
| Month | Jan | Feb | Mar | Apr | May | Jun | Jul | Aug | Sep | Oct | Nov | Dec | Year |
| Record high °C (°F) | 44.0 (111.2) |
43.8 (110.8) |
41.9 (107.4) |
37.7 (99.9) |
36.8 (98.2) |
34.2 (93.6) |
37.2 (99.0) |
40.0 (104.0) |
43.0 (109.4) |
45.6 (114.1) |
44.8 (112.6) |
45.0 (113.0) |
45.6 (114.1) |
| Average high °C (°F) | 35.1 (95.2) |
33.8 (92.8) |
32.8 (91.0) |
28.8 (83.8) |
25.4 (77.7) |
23.4 (74.1) |
24.1 (75.4) |
27.1 (80.8) |
29.1 (84.4) |
32.2 (90.0) |
33.2 (91.8) |
34.4 (93.9) |
30.0 (86.0) |
| Daily mean °C (°F) | 27.9 (82.2) |
26.8 (80.2) |
25.8 (78.4) |
22.5 (72.5) |
18.8 (65.8) |
16.9 (62.4) |
16.6 (61.9) |
19.1 (66.4) |
21.2 (70.2) |
24.6 (76.3) |
25.9 (78.6) |
27.3 (81.1) |
22.8 (73.0) |
| Average low °C (°F) | 21.7 (71.1) |
21.1 (70.0) |
20.3 (68.5) |
17.5 (63.5) |
13.7 (56.7) |
11.8 (53.2) |
10.4 (50.7) |
12.2 (54.0) |
14.2 (57.6) |
17.8 (64.0) |
19.3 (66.7) |
20.9 (69.6) |
16.7 (62.1) |
| Record low °C (°F) | 9.8 (49.6) |
10.0 (50.0) |
6.4 (43.5) |
1.8 (35.2) |
−3.0 (26.6) |
−4.4 (24.1) |
−5.9 (21.4) |
−4.8 (23.4) |
−1.4 (29.5) |
4.4 (39.9) |
5.8 (42.4) |
8.6 (47.5) |
−5.9 (21.4) |
| Average precipitation mm (inches) | 142.4 (5.61) |
116.7 (4.59) |
160.4 (6.31) |
84.6 (3.33) |
57.5 (2.26) |
18.6 (0.73) |
13.1 (0.52) |
16.1 (0.63) |
30.4 (1.20) |
72.5 (2.85) |
119.0 (4.69) |
132.6 (5.22) |
963.9 (37.95) |
| Average precipitation days (≥ 0.1 mm) | 8.8 | 9.2 | 9.9 | 9.3 | 7.1 | 6.0 | 3.9 | 2.9 | 4.4 | 7.3 | 8.7 | 8.8 | 86.3 |
| Average relative humidity (%) | 69.3 | 72.2 | 75.2 | 79.4 | 79.9 | 79.3 | 71.3 | 62.8 | 60.5 | 62.7 | 65.9 | 68.2 | 70.6 |
| Mean monthly sunshine hours | 272.8 | 246.4 | 235.6 | 210.0 | 192.2 | 162.0 | 192.2 | 213.9 | 207.0 | 260.4 | 261.0 | 263.5 | 2,717 |
| Percent possible sunshine | 64 | 68 | 62 | 59 | 56 | 51 | 58 | 60 | 57 | 63 | 64 | 62 | 60 |
| Source 1: Servicio Meteorológico Nacional[10][9] | |||||||||||||
| Source 2: NOAA (sun 1961–1990)[5] | |||||||||||||
References
- "Datos de Municipios" (in Spanish). Ministerio del Interior y Transporte. Retrieved June 19, 2015.
- Peel, M. C. and Finlayson, B. L. and McMahon, T. A. (2007). "Updated world map of the Köppen–Geiger climate classification" (PDF). Hydrol. Earth Syst. Sci. 11 (5): 1633–1644. doi:10.5194/hess-11-1633-2007. ISSN 1027-5606.CS1 maint: multiple names: authors list (link)
- "Datos extremos en el país y en el mundo" (in Spanish). Servicio Meteorológico Nacional. Retrieved June 19, 2015.
- "Datos Estadísticos (Período 1981-1990)" (in Spanish). Servicio Meteorológico Nacional. Retrieved June 19, 2015.
- "Las Lomitas Climate Normals 1961–1990". National Oceanic and Atmospheric Administration. Retrieved March 15, 2015.
- "Datos bioclimáticos de 173 localidades argentinas–Anuales". Atlas Bioclimáticos (in Spanish). Universidad Nacional de La Plata. Retrieved June 18, 2015.
- "Las Lomitas, Formosa". Estadísticas meteorológicas decadiales (in Spanish). Oficina de Riesgo Agropecuario. Retrieved June 14, 2015.
- "Valores Medios de Temperature y Precipitación-Formosa: Las Lomitas" (in Spanish). Servicio Meteorológico Nacional. Retrieved March 29, 2015.
- "Clima en la Argentina: Guia Climática por Las Lomitas". Caracterización: Estadísticas de largo plazo (in Spanish). Servicio Meteorológico Nacional. Archived from the original on 4 September 2017. Retrieved 4 October 2017.
- "Estadísticas Climatológicas Normales - período 1981-2010" (in Spanish). Servicio Meteorológico Nacional. Retrieved January 20, 2018.