WarpPLS
WarpPLS is a software with graphical user interface for variance-based and factor-based structural equation modeling (SEM) using the partial least squares and factor-based methods.[1][2] The software can be used in empirical research to analyse collected data (e.g., from questionnaire surveys) and test hypothesized relationships. Since it runs on the MATLAB Compiler Runtime, it does not require the MATLAB software development application to be installed; and can be installed and used on various operating systems in addition to Windows, with virtual installations.
 WarpPLS Logo | |
| Original author(s) | Ned Kock |
|---|---|
| Initial release | 2009 |
| Stable release | |
| Operating system | Windows |
| Platform | MATLAB |
| Available in | English |
| Type | Statistical analysis, data collection, structural equation modeling, multivariate analysis |
| License | Proprietary software |
| Website | www |
WarpPLS has been used to study a number of topics in a variety of disciplines and fields, including: accounting, anthropology, clinical psychology, ecology, economics, education, global environmental change, epidemiology, evolutionary psychology, exercise physiology, information systems, international business, finance, management, marketing, medicine, nursing, organizational psychology, and sociology.[3]
Main features
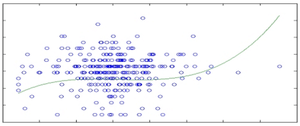
Among the main features of WarpPLS is its ability to identify and model non-linearity among variables in path models, whether these variables are measured as latent variables or not, yielding parameters that take the corresponding underlying heterogeneity into consideration.[4][5] This and other notable features are summarized through the list below.
- Guides SEM analysis flow via a step-by-step user interface guide.[6]
- Implements classic (composite-based) as well as factor-based PLS algorithms.
- Identifies nonlinear relationships, and estimates path coefficients accordingly.
- Also models linear relationships, using classic and factor-based PLS algorithms.
- Models reflective and formative variables, as well as moderating effects.
- Calculates P values, model fit and quality indices, and full collinearity coefficients.
- Calculates effect sizes and Q-squared predictive validity coefficients.
- Calculates indirect effects for paths with 2, 3 etc. segments; as well as total effects.
- Calculates several causality assessment coefficients.
- Provides zoomed 2D graphs and 3D graphs.
See also
References
- Kock, N., & Mayfield, M. (2015). PLS-based SEM algorithms: The good neighbor assumption, collinearity, and nonlinearity. Information Management and Business Review, 7(2), 113-130.
- Kock, N. (2015). A note on how to conduct a factor-based PLS-SEM analysis. International Journal of e-Collaboration, 11(3), 1-9.
- Google Scholar list of links to academic publications using or discussing WarpPLS
- Gountas, S., & Gountas, J. (2016). How the ‘warped’ relationships between nurses' emotions, attitudes, social support and perceived organizational conditions impact customer orientation. Journal of Advanced Nursing, 72(2), 283-293.
- Guo, K.H., Yuan, Y., Archer, N.P., & Connelly, C.E. (2011). Understanding nonmalicious security violations in the workplace: A composite behavior model. Journal of Management Information Systems, 28(2), 203-236.
- Short YouTube video illustrating step-by-step user interface guide