Troposphere
The troposphere is the lowest layer of Earth's atmosphere, and is also where nearly all weather conditions take place. It contains 75% of the atmosphere's mass and 99% of the total mass of water vapour and aerosols.[2] The average height of the troposphere is 18 km (11 mi; 59,000 ft) in the tropics, 17 km (11 mi; 56,000 ft) in the middle latitudes, and 6 km (3.7 mi; 20,000 ft) in the polar regions in winter. The total average height of the troposphere is 13 km.

The lowest part of the troposphere, where friction with the Earth's surface influences airflow, is the planetary boundary layer. This layer is typically a few hundred meters to 2 km (1.2 mi; 6,600 ft) deep depending on the landform and time of day. Atop the troposphere is the tropopause, which is the border between the troposphere and stratosphere. The tropopause is an inversion layer, where the air temperature ceases to decrease with height and remains constant through its thickness.[3]
The word troposphere is derived from the Greek tropos (meaning "turn, turn toward, change") and sphere (as in the Earth), reflecting the fact that rotational turbulent mixing plays an important role in the troposphere's structure and behaviour. Most of the phenomena associated with day-to-day weather occur in the troposphere.[3]

Pressure and temperature structure
Composition
By volume, dry air contains 78.08% nitrogen, 20.95% oxygen, 0.93% argon, 0.04% carbon dioxide, and small amounts of other gases. Air also contains a variable amount of water vapor. Except for the water vapor content, the composition of the troposphere is essentially uniform. The source of water vapor is at the Earth's surface through the process of evaporation. The temperature of the troposphere decreases with altitude. And, saturation vapor pressure decreases strongly as temperature drops. Hence, the amount of water vapor that can exist in the atmosphere decreases strongly with altitude and the proportion of water vapor is normally greatest near the surface of the Earth.
Pressure
The pressure of the atmosphere is maximum at sea level and decreases with altitude. This is because the atmosphere is very nearly in hydrostatic equilibrium so that the pressure is equal to the weight of air above a given point. The change in pressure with altitude can be equated to the density with the hydrostatic equation[4]
where:
- gn is the standard gravity
- ρ is the density
- z is the altitude
- P is the pressure
- R is the gas constant
- T is the thermodynamic (absolute) temperature
- m is the molar mass
Since temperature in principle also depends on altitude, one needs a second equation to determine the pressure as a function of altitude as discussed in the next section.
Temperature

The temperature of the troposphere generally decreases as altitude increases. The rate at which the temperature decreases, , is called the environmental lapse rate (ELR). The ELR is nothing more than the difference in temperature between the surface and the tropopause divided by the height. The ELR assumes that the air is perfectly still, i.e. that there is no mixing of the layers of air from vertical convection, nor winds that would create turbulence and hence mixing of the layers of air. The reason for this temperature difference is that the ground absorbs most of the sun's energy, which then heats the lower levels of the atmosphere with which it is in contact. Meanwhile, the radiation of heat at the top of the atmosphere results in the cooling of that part of the atmosphere.
| Altitude Region | Lapse rate | Lapse Rate |
|---|---|---|
| (m) | (°C/km) | (°F/1000 feet) |
| 0 – 11,000 | 6.5 | 3.57 |
| 11,000 – 20,000 | 0.0 | 0.0 |
| 20,000 – 32,000 | -1.0 | -0.55 |
| 32,000 – 47,000 | -2.8 | -1.54 |
| 47,000 – 51,000 | 0.0 | 0.0 |
| 51,000 – 71,000 | 2.8 | 1.54 |
| 71,000 – 85,000 | 2.0 | 1.09 |
The ELR assumes the atmosphere is still, but as air is heated it becomes buoyant and rises. The dry adiabatic lapse rate accounts for the effect of the expansion of dry air as it rises in the atmosphere and wet adiabatic lapse rates include the effect of the condensation of water vapor on the lapse rate.
When a parcel of air rises, it expands because the pressure is lower at higher altitudes. As the air parcel expands, it pushes the surrounding air outward, transferring energy in the form of work from that parcel to the atmosphere. As energy transfer to a parcel of air by way of heat is very slow, it is assumed to not exchange energy by way of heat with the environment. Such a process is called an adiabatic process (no energy transfer by way of heat). Since the rising parcel of air is losing energy as it does work on the surrounding atmosphere and no energy is transferred into it as heat from the atmosphere to make up for the loss, the parcel of air is losing energy, which manifests itself as a decrease in the temperature of the air parcel. The reverse, of course, will be true for a parcel of air that is sinking and is being compressed.[3]
Since the process of compression and expansion of an air parcel can be considered reversible and no energy is transferred into or out of the parcel, such a process is considered isentropic, meaning that there is no change in entropy as the air parcel rises and falls, . Since the heat exchanged is related to the entropy change by , the equation governing the temperature as a function of height for a thoroughly mixed atmosphere is
where S is the entropy. The above equation states that the entropy of the atmosphere does not change with height. The rate at which temperature decreases with height under such conditions is called the adiabatic lapse rate.
For dry air, which is approximately an ideal gas, we can proceed further. The adiabatic equation for an ideal gas is[5]
where is the heat capacity ratio (=7/5, for air). Combining with the equation for the pressure, one arrives at the dry adiabatic lapse rate,[6]
If the air contains water vapor, then cooling of the air can cause the water to condense, and the behavior is no longer that of an ideal gas. If the air is at the saturated vapor pressure, then the rate at which temperature drops with height is called the saturated adiabatic lapse rate. More generally, the actual rate at which the temperature drops with altitude is called the environmental lapse rate. In the troposphere, the average environmental lapse rate is a drop of about 6.5 °C for every 1 km (1,000 meters) in increased height.[3]
The environmental lapse rate (the actual rate at which temperature drops with height, ) is not usually equal to the adiabatic lapse rate (or correspondingly, ). If the upper air is warmer than predicted by the adiabatic lapse rate (), then when a parcel of air rises and expands, it will arrive at the new height at a lower temperature than its surroundings. In this case, the air parcel is denser than its surroundings, so it sinks back to its original height, and the air is stable against being lifted. If, on the contrary, the upper air is cooler than predicted by the adiabatic lapse rate, then when the air parcel rises to its new height it will have a higher temperature and a lower density than its surroundings, and will continue to accelerate upward.[3][4]
The troposphere is heated from below by latent heat, longwave radiation, and sensible heat. Surplus heating and vertical expansion of the troposphere occurs in the tropics. At middle latitudes, tropospheric temperatures decrease from an average of 15 °C (59-degree Fahrenheit) at sea level to about −55 °C (-67-degree Fahrenheit) at the tropopause. At the poles, the tropospheric temperature only decreases from an average of 0 °C (32-degree Fahrenheit) at sea level to about −45 °C (-49-degree Fahrenheit) at the tropopause. At the equator, tropospheric temperatures decrease from an average of 20 °C (68-degree Fahrenheit) at sea level to about −70 to −75 °C (-94 to -103-degree Fahrenheit) at the tropopause. The troposphere is thinner at the poles and thicker at the equator. The average thickness of the tropical troposphere is roughly 7 kilometers greater than the average tropospheric thickness at the poles.[7]
Tropopause
The tropopause is the boundary region between the troposphere and the stratosphere.
Measuring the temperature change with height through the troposphere and the stratosphere identifies the location of the tropopause. In the troposphere, temperature decreases with altitude. In the stratosphere, however, the temperature remains constant for a while and then increases with altitude. This coldest layer of the atmosphere, where the lapse rate changes from positive (in the troposphere) to negative (in the stratosphere), is defined as the tropopause.[3] Thus, the tropopause is an inversion layer, and there is little mixing between the two layers of the atmosphere.
Atmospheric flow
The flow of the atmosphere generally moves in a west to east direction. This, however, can often become interrupted, creating a more north to south or south to north flow. These scenarios are often described in meteorology as zonal or meridional. These terms, however, tend to be used about localized areas of the atmosphere (at a synoptic scale). A fuller explanation of the flow of atmosphere around the Earth as a whole can be found in the three-cell model.
Zonal flow


A zonal flow regime is the meteorological term meaning that the general flow pattern is west to east along the Earth's latitude lines, with weak shortwaves embedded in the flow.[8] The use of the word "zone" refers to the flow being along the Earth's latitudinal "zones". This pattern can buckle and thus become a meridional flow.
Meridional flow

When the zonal flow buckles, the atmosphere can flow in a more longitudinal (or meridional) direction, and thus the term "meridional flow" arises. Meridional flow patterns feature strong, amplified troughs of low pressure and ridges of high pressure, with more north-south flow in the general pattern than west-to-east flow.[9]
Three-cell model

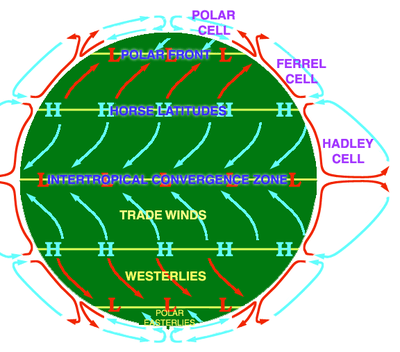
The three-cell model of the atmosphere attempts to describe the actual flow of the Earth's atmosphere as a whole. It divides the Earth into the tropical (Hadley cell), mid-latitude (Ferrel cell), and polar (polar cell) regions, to describe energy flow and global atmospheric circulation (mass flow). Its fundamental principle is that of balance – the energy that the Earth absorbs from the sun each year is equal to that which it loses to space by radiation. This overall Earth energy balance, however, does not apply in each latitude due to the varying strength of the sun in each "cell" as a result of the tilt of the Earth's axis concerning its orbit. The result is a circulation of the atmosphere that transports warm air poleward from the tropics and cold air equatorward from the poles. The effect of the three cells is the tendency to even out the heat and moisture in the Earth's atmosphere around the planet.[10]
Synoptic scale observations and concepts
Forcing
Forcing is a term used by meteorologists to describe the situation where a change or an event in one part of the atmosphere causes a strengthening change in another part of the atmosphere. It is usually used to describe connections between upper, middle or lower levels (such as upper-level divergence causing lower level convergence in cyclone formation), but also be to describe such connections over lateral distance rather than height alone. In some respects, teleconnections could be considered a type of forcing.
Divergence and convergence
An area of convergence is one in which the total mass of air is increasing with time, resulting in an increase in pressure at locations below the convergence level (recall that atmospheric pressure is just the total weight of air above a given point). Divergence is the opposite of convergence – an area where the total mass of air is decreasing with time, resulting in falling pressure in regions below the area of divergence. Where divergence is occurring in the upper atmosphere, there will be air coming in to try to balance the net loss of mass (this is called the principle of mass conservation), and there is a resulting upward motion (positive vertical velocity). Another way to state this is to say that regions of upper air divergence are conducive to lower level convergence, cyclone formation, and positive vertical velocity. Therefore, identifying regions of upper air divergence is an important step in forecasting the formation of a surface low-pressure area.
Stratosphere
References
- "STS-130 Shuttle Mission Imagery". NASA. Retrieved 21 September 2012.
- "Troposphere". Concise Encyclopedia of Science & Technology. McGraw-Hill. 1984.
It contains about four-fifths of the mass of the whole atmosphere.
- Danielson, Levin, and Abrams (2003). Meteorology. McGraw Hill.CS1 maint: uses authors parameter (link)
- Landau and Lifshitz, Fluid Mechanics, Pergamon, 1979
- Landau and Lifshitz, Statistical Physics Part 1, Pergamon, 1980
- Kittel and Kroemer, Thermal Physics, Freeman, 1980; chapter 6, problem 11
- Paul E. Lydolph (1985). "The Climate of the Earth". Rowman and Littlefield Publishers Inc. p. 12. Missing or empty
|url=(help) - "American Meteorological Society Glossary – Zonal Flow". Allen Press Inc. June 2000. Archived from the original on 2007-03-13. Retrieved 2006-10-03.
- "American Meteorological Society Glossary – Meridional Flow". Allen Press Inc. June 2000. Archived from the original on 2006-10-26. Retrieved 2006-10-03.
- "Meteorology – MSN Encarta, "Energy Flow and Global Circulation"". Encarta.Msn.com. Archived from the original on 2009-10-28. Retrieved 2006-10-13.
External links
| Look up troposphere in Wiktionary, the free dictionary. |