The Observatory of Economic Complexity
The Observatory of Economic Complexity is a data visualization site for international trade data created by the Macro Connections group at the MIT Media Lab. The goal of the observatory is to distribute international trade data in a visual form. At present the observatory serves more than 20 million interactive visualizations, connecting hundreds of countries to their export destinations and to the products that they trade.

Source data
The Observatory of Economic Complexity combines a number of international trade data sets, including data from Feenstra, Lipset, Deng, Ma, and Mo's World Trade Flows: 1962-2000 dataset,[1] cleaned and made compatible through a National Bureau of Economic Research (NBER) project and HS4 aggregated from the HS6 classification cleaned by the BACI team at Centre d'Etudes Prospectives et d'Informations Internationales (CEPII).[2] The dataset contains exports and imports both by country of origin and by destination. Products are disaggregated according to the Standardized International Trade Code at the four-digit level (SITC-4) and the Harmonized Systems at the four digit level (HS-4).
Currently, data is available from 1962 through 2017.
Visualizations
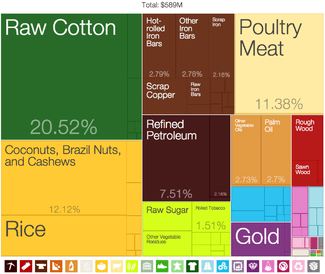
Products, represented by rectangles, are drawn from the 775 individual product classes found in the Standardized International Trade Code at the four-digit level (SITC-4). The rectangle's color corresponds to the 34 product communities found in the Product Space and other visualizations from The Observatory of Economic Complexity. Product Exports Treemaps in The Observatory of Economic Complexity graphically represent product's share of a nation's trade (imports or exports). The larger the size of the rectangle, the larger the product's share of that country's imports or exports.
An example from Benin in 2009 is shown on the right.
Additional visual representations include
- Stacked Area Charts
- The Product Space
- Predictive Tools
- Maps
- Rings
D3plus is the underlying engine responsible for generating all of the visualization used on the site. D3plus is an open source (MIT license)[3] JavaScript library built on top of D3.js by Alexander Simoes and Dave Landry. It is also used on other visualization themed sites such as DataViva and Pantheon.
See also
- Complexity economics
- Economic Complexity Index
- List of countries by economic complexity
References
- R.R. Feenstra, H.D. Lipsey, A. Ma, H. Mo, HBER Work. Pap 11040 (2005).
- Guillaume Gaulier, Soledad Zignago, "BACI: International Trade Database at the Product-Level. The 1994-2007 Version" (2010) .
- "d3plus source". Retrieved May 8, 2014.
External links
- Official website
- Hausmann, Ricardo; Hidalgo, César A.; et al. (2014) [2011]. The Atlas of Economic Complexity. Hollis New Hampshire: Puritan Press. ISBN 978-0262525428.
