Texas's 26th congressional district
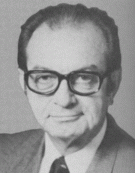
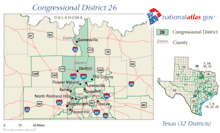
Texas's 26th congressional district of the United States House of Representatives includes the area in the northern portion of the Dallas-Fort Worth Metroplex centering on Denton County. The current Representative is Michael C. Burgess. The district is best known as the seat of former House Majority Leader Dick Armey.
| Texas's 26th congressional district | |||
|---|---|---|---|
.tif.png) Texas's 26th congressional district - since January 3, 2013. | |||
| Representative |
| ||
| Distribution |
| ||
| Population (2016) | 845,376[2] | ||
| Median income | $91,650[3] | ||
| Ethnicity |
| ||
| Cook PVI | R+18[4] | ||
History
The district was created after the 1980 census due to population growth in Texas and Denton County, specifically in its southern sector. From the beginning, the district map has been centered on Denton County, one of Texas's fastest-growing counties.
Except for the first election, won by Democrat Tom Vandergriff in 1982, the seat has been held by Republicans. As Denton County has become overwhelmingly Republican in recent years (every county officeholder is Republican, as are all of the members of the Texas Legislature representing the county), the 26th district is considered a "safe seat" for the GOP.
Since the 2010 redistricting, the 26th district includes most of Denton County (except the southeast portion) and a portion of north central Tarrant County.
List of members representing the district
| Representative | Party | Years | Congress | Electoral history |
|---|---|---|---|---|
 |
Democratic | January 3, 1983 – January 3, 1985 |
98th | Elected in 1982. Lost re-election. |
 |
Republican | January 3, 1985 – January 3, 2003 |
99th 100th 101st 102nd 103rd 104th 105th 106th 107th |
First elected in 1984. Re-elected in 1986. Re-elected in 1988. Re-elected in 1990. Re-elected in 1992. Re-elected in 1994. Re-elected in 1996. Re-elected in 1998. Re-elected in 2000. Retired. |
 |
Republican | January 3, 2003 – present |
108th 109th 110th 111th 112th 113th 114th 115th 116th |
First elected in 2002. Re-elected in 2004. Re-elected in 2006. Re-elected in 2008. Re-elected in 2010. Re-elected in 2012. Re-elected in 2014. Re-elected in 2016. Re-elected in 2018. |
Recent election results
2004 election
| Party | Candidate | Votes | % | ± | |
|---|---|---|---|---|---|
| Republican | Michael Burgess | 180,519 | 65.75 | -9.1 | |
| Democratic | Lico Reyes | 89,809 | 32.71 | +9.9 | |
| Libertarian | James Gholston | 4,211 | 1.53 | +0.1 | |
| Majority | 90,710 | 33.0 | |||
| Turnout | 274,539 | ||||
| Republican hold | Swing | -9.5 | |||
2006 election
| Party | Candidate | Votes | % | ± | |
|---|---|---|---|---|---|
| Republican | Michael Burgess | 94,219 | 60.21 | -5.54 | |
| Democratic | Tim Barnwell | 58,271 | 37.23 | +4.52 | |
| Libertarian | Rich Haas | 3,993 | 2.55 | +1.02 | |
| Majority | 35,948 | 22.97 | |||
| Turnout | 156,483 | ||||
| Republican hold | Swing | -5.03 | |||
2008 election
| Party | Candidate | Votes | % | ± | |
|---|---|---|---|---|---|
| Republican | Michael Burgess | 194,849 | 60.19 | -0.02 | |
| Democratic | Ken Leach | 117,895 | 36.42 | -0.82 | |
| Libertarian | Stephanie Weiss | 11,002 | 3.40 | 0.85 | |
| Majority | 76,954 | 23.77 | +0.8 | ||
| Turnout | 323,746 | ||||
| Republican hold | Swing | -0.02 | |||
2010 election
| Party | Candidate | Votes | % | ± | |
|---|---|---|---|---|---|
| Republican | Michael Burgess | 120,683 | 67.08 | +6.89 | |
| Democratic | Neil Durrance | 55,182 | 30.67 | -5.75 | |
| Libertarian | Mark Boler | 4,049 | 2.25 | -1.15 | |
| Majority | 65,501 | 36.41 | +12.64 | ||
| Turnout | 179,914 | ||||
| Republican hold | Swing | +6.89 | |||
2016 election
| Party | Candidate | Votes | % | ± | |
|---|---|---|---|---|---|
| Republican | Michael Burgess | 211,730 | 66.4 | -0.68 | |
| Democratic | Eric Mauck | 94,507 | 29.6 | -1.07 | |
| Libertarian | Mark Boler | 12,843 | 4.0 | +1.75 | |
| Majority | 117,223 | 36.8 | +0.39 | ||
| Turnout | 319,080 | ||||
| Republican hold | Swing | -0.68 | |||
2018 election
| Party | Candidate | Votes | % | ± | |
|---|---|---|---|---|---|
| Republican | Michael Burgess | 185,551 | 59.4 | -7.0 | |
| Democratic | Linsey Fagan | 121,938 | 39.0 | +9.4 | |
| Libertarian | Mark Boler | 5,016 | 1.6 | -2.4 | |
| Majority | 59,613 | 20.4 | -16.4 | ||
| Turnout | 312,505 | ||||
| Republican hold | Swing | -7.0 | |||
Historical district boundaries

References
- https://www.census.gov/geo/maps-data/data/cd_state.html
- https://www.census.gov/mycd/?st=48&cd=26
- https://www.census.gov/mycd/?st=48&cd=26
- "Partisan Voting Index – Districts of the 115th Congress" (PDF). The Cook Political Report. April 7, 2017. Retrieved April 7, 2017.
- Martis, Kenneth C. (1989). The Historical Atlas of Political Parties in the United States Congress. New York: Macmillan Publishing Company.
- Congressional Biographical Directory of the United States 1774–present