Texas's 24th congressional district
Texas's 24th congressional district of the United States House of Representatives covers much of the suburban area in between Fort Worth and Dallas in the state of Texas. The district centers along the Dallas-Tarrant county line, and includes the southeastern corner of Denton County as well.
| Texas's 24th congressional district | |||
|---|---|---|---|
.tif.png) Texas's 24th congressional district - since January 3, 2013. | |||
| Representative |
| ||
| Distribution |
| ||
| Population (2016) | 790,319[2] | ||
| Median income | $74,127[2] | ||
| Ethnicity |
| ||
| Cook PVI | R+9[3] | ||
Recent election results from statewide races
| Year | U.S. President | U.S. Senator | Governor |
|---|---|---|---|
| 2008 | McCain (R): 55 – 44% | [Data unknown/missing] | — |
| 2012 | Romney (R): 60 – 38% | Cruz (R): 60 – 37% | — |
| 2016 | Trump (R): 51 – 45% | — | — |
| 2018 | — | O'Rourke (D): 51 – 48%[4] | Abbott (R): 54 – 44% |
List of members representing the district
| Member | Party | Years | Cong ress |
Electoral history | District location |
|---|---|---|---|---|---|
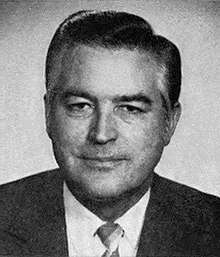 Dale Milford |
Democratic | January 3, 1973 – January 3, 1979 |
93rd 94th 95th |
Elected in 1972. Re-elected in 1974. Re-elected in 1976. Lost renomination. |
1973–1983 [data unknown/missing] |
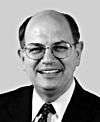 Martin Frost |
Democratic | January 3, 1979 – January 3, 2005 |
96th 97th 98th 99th 100th 101st 102nd 103rd 104th 105th 106th 107th 108th |
Elected in 1978. Re-elected in 1980. Re-elected in 1982. Re-elected in 1984. Re-elected in 1986. Re-elected in 1988. Re-elected in 1990. Re-elected in 1992. Re-elected in 1994. Re-elected in 1996. Re-elected in 1998. Re-elected in 2000. Re-elected in 2002. Redistricted to the 6th district in the 2003 Texas redistricting, but instead moved to the 32nd district and lost re-election. | |
| 1983–1993 [data unknown/missing] | |||||
| 1993–2003 [data unknown/missing] | |||||
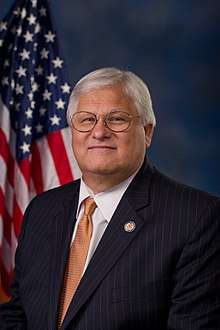 Kenny Marchant |
Republican | January 3, 2005 – Present |
109th 110th 111th 112th 113th 114th 115th 116th |
Elected in 2004. Re-elected in 2006. Re-elected in 2008. Re-elected in 2010. Re-elected in 2012. Re-elected in 2014. Re-elected in 2016. Re-elected in 2018. Retiring. |
2003–2007 [data unknown/missing] |
2007–2013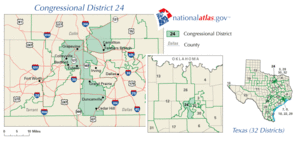 | |||||
2013–present.tif.png) |
Recent election results
| 2004 • 2006 • 2008 • 2010 • 2012 • 2014 • 2016 • 2018 |
2004
| Party | Candidate | Votes | % | ± | |
|---|---|---|---|---|---|
| Republican | Kenny Marchant | 154,435 | 64.0% | +30.0 | |
| Democratic | Gary Page | 82,599 | 34.2% | -30.5 | |
| Libertarian | James Lawrence (Texas) | 4,340 | 1.8% | +0.4 | |
| Majority | 71,836 | ||||
| Turnout | 241,374 | 29.8% | |||
| Republican gain from Democratic | Swing | +30.2 | |||
2006
| Party | Candidate | Votes | % | ± | |
|---|---|---|---|---|---|
| Republican | Kenny Marchant | 83,620 | 60.0% | -4.0 | |
| Democratic | Gary Page | 51,833 | 37.0% | +2.8 | |
| Libertarian | Mark Frohman | 4,211 | 3.0% | +1.2 | |
2008
| Party | Candidate | Votes | % | ± | |
|---|---|---|---|---|---|
| Republican | Kenny Marchant | 151,740 | 55.91% | -4.09 | |
| Democratic | Tom Love (Texas)[6] | 111,649 | 41.14% | +4.14 | |
| Libertarian | David A. Casey[7] | 7,969 | 2.93% | +0.13 | |
2010
| Party | Candidate | Votes | % | ± | |
|---|---|---|---|---|---|
| Republican | Kenny Marchant | 81.6% | |||
| Libertarian | David Sparks | 18.4% | |||
2012
| Party | Candidate | Votes | % | ± | |
|---|---|---|---|---|---|
| Republican | Kenny Marchant | 61% | |||
| Democratic | Tim Rusk (Texas) | 36% | |||
| Libertarian | John Stathas | 3% | |||
2014
| Party | Candidate | Votes | % | ± | |
|---|---|---|---|---|---|
| Republican | Kenny Marchant | 93,446 | 65.1% | ||
| Democratic | Patrick McGehearty | 46,360 | 32.3% | ||
| Libertarian | Mike Kolls | 3,799 | 2.6% | ||
2016
| Party | Candidate | Votes | % | ± | |
|---|---|---|---|---|---|
| Republican | Kenny Marchant | 154,364 | 56.2% | -8.9 | |
| Democratic | Jan McDowell | 107,845 | 39.3% | +7.0 | |
| Libertarian | Mike Kolls | 8,574 | 3.1% | +0.5 | |
2018
| Party | Candidate | Votes | % | ± | |
|---|---|---|---|---|---|
| Republican | Kenny Marchant | 133,317 | 50.6% | -5.6 | |
| Democratic | Jan McDowell | 125,231 | 47.5% | +8.2 | |
| Libertarian | Mike Kolls | 4,870 | 1.8% | -1.3 | |
gollark: People probably can't distinguish that many colors very well. So we can just have a pool of 60 or so.
gollark: You misspelt "more" somehow?
gollark: And people can share color roles which are close enough together.
gollark: We do not have that many active people.
gollark: The limit is 256.
References
- https://www.census.gov/geo/maps-data/data/cd_state.html
- Center for New Media & Promotion (CNMP), US Census Bureau. "My Congressional District". www.census.gov.
- "Partisan Voting Index – Districts of the 115th Congress" (PDF). The Cook Political Report. April 7, 2017. Retrieved April 7, 2017.
- "Texas 2018 Senate and governor by Congressional District". Google Docs.
- 2008 Election Results accessed 5 November 2008
- Tom Love 08 Archived 2008-09-03 at the Wayback Machine accessed 25 May 2008
- David A. Casey for Congress accessed 21 March 2012
- 2010 Election Results accessed 5 April 2013
- 2012 Election Results accessed 5 April 2013
- "Texas Election Results 2014: House Map by District, Live Midterm Voting Updates". POLITICO. Retrieved 2020-07-02.
- accessed 30 January 2017
- accessed 5 March 2019
- Martis, Kenneth C. (1989). The Historical Atlas of Political Parties in the United States Congress. New York: Macmillan Publishing Company.
- Martis, Kenneth C. (1982). The Historical Atlas of United States Congressional Districts. New York: Macmillan Publishing Company.
- Congressional Biographical Directory of the United States 1774–present
This article is issued from Wikipedia. The text is licensed under Creative Commons - Attribution - Sharealike. Additional terms may apply for the media files.