Texas's 29th congressional district
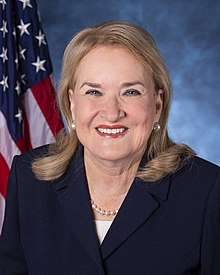
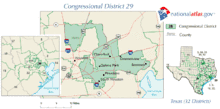
Texas's 29th congressional district of the United States House of Representatives covers the eastern portion of the Greater Houston area in the state of Texas. The current Representative from the 29th district is Democrat Sylvia Garcia.
| Texas's 29th congressional district | |||
|---|---|---|---|
.tif.png) Texas's 29th congressional district - since January 3, 2013. | |||
| Representative |
| ||
| Distribution |
| ||
| Population (2016) | 765,403[2] | ||
| Median income | $42,792[3] | ||
| Ethnicity |
| ||
| Cook PVI | D+19[4] | ||
The Texas State Legislature established the district as a majority-Hispanic or Latino district. Democrat Gene Green, a non-Hispanic white, won the first election for the district in 1992 and held it for 18 terms.[5] In November 2017, Green announced that he would retire from Congress and would not run for re-election in 2018. Garcia won the election to succeed him.
Cities within the district
Cities wholly in the district
List of members representing the district
| Representative | Party | Years | Congress | Electoral history |
|---|---|---|---|---|
| District created | January 3, 1993 | |||
 Gene Green |
Democratic | January 3, 1993 – January 3, 2019 |
103rd 104th 105th 106th 107th 108th 109th 110th 111th 112th 113th 114th 115th |
Elected in 1992. Re-elected in 1994. Re-elected in 1996. Re-elected in 1998. Re-elected in 2000. Re-elected in 2002. Re-elected in 2004. Re-elected in 2006. Re-elected in 2008. Re-elected in 2010. Re-elected in 2012. Re-elected in 2014. Re-elected in 2016. Retired. |
 Sylvia Garcia |
Democratic | January 3, 2019 – present |
116th | Elected in 2018. |
Election results
| Party | Candidate | Votes | % | ± | |
|---|---|---|---|---|---|
| Democratic | Gene Green | 78,256 | 94.1 | -1.0 | |
| Libertarian | Clifford Messina | 4,868 | 5.9 | +1.0 | |
| Majority | 73,388 | 88.3 | |||
| Turnout | 83,124 | ||||
| Democratic hold | Swing | -1.0 | |||
| Party | Candidate | Votes | % | ± | |
|---|---|---|---|---|---|
| Democratic | Gene Green | 37,174 | 74% | -20,1% | |
| Republican | Eric Story | 12,347 | 24% | +24% | |
| Majority | 24,827 | 50% | |||
| Turnout | 49,521 | ||||
| Democratic hold | Swing | ||||
| Party | Candidate | Votes | % | ± | |
|---|---|---|---|---|---|
| Democratic | Gene Green | 79,718 | 75% | +10.4 | |
| Republican | Eric Story | 25,512 | 24% | -10.1% | |
| Majority | 54,206 | 51% | |||
| Turnout | 105,230 | ||||
| Democratic hold | Swing | -1.0 | |||
| Party | Candidate | Votes | % | ± | |
|---|---|---|---|---|---|
| Democratic | Gene Green | 43,185 | 64.6% | -10.4% | |
| Republican | Roy Morales | 22,756 | 34.1% | +10.1% | |
| Majority | 20,399 | 30.5% | |||
| Turnout | 65,941 | ||||
| Democratic hold | Swing | ||||
Historical district boundaries

gollark: Muahahaha. Heavserver time!
gollark: https://top.gg/bot/510789298321096704
gollark: Oh.
gollark: I can add it to heavserver?
gollark: Yes, it is inconsistency 1298712.
References
- https://www.census.gov/geo/maps-data/data/cd_state.html
- https://www.census.gov/mycd/?st=48&cd=29
- https://www.census.gov/mycd/?st=48&cd=29
- "Partisan Voting Index – Districts of the 115th Congress" (PDF). The Cook Political Report. April 7, 2017. Retrieved April 7, 2017.
- "Political challenge: Revised council redistricting plan offers Hispanics a third majority district." (editorial) Houston Chronicle. Wednesday May 18, 2011. Retrieved on November 5, 2011.
This article is issued from Wikipedia. The text is licensed under Creative Commons - Attribution - Sharealike. Additional terms may apply for the media files.