Standard curve
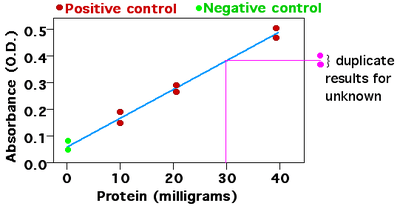
A standard curve, also known as a calibration curve, is a type of graph used as a quantitative research technique. Multiple samples with known properties are measured and graphed, which then allows the same properties to be determined for unknown samples by interpolation on the graph. The samples with known properties are the standards, and the graph is the standard curve. The concentration of the unknown may be calculated from the mass in the assay.

Example

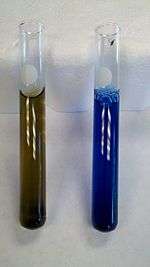
The Bradford assay is a colorimetric assay that measures protein concentration. The reagent Coomassie Brilliant Blue turns blue when it binds to arginine and aromatic amino acids present in proteins, thus increasing the absorbance of the sample. The absorbance is measured using a spectrophotometer, at the maximum absorbance frequency (Amax) of the blue dye (which is 595 nm). In this case, the greater the absorbance, the higher the protein concentration.
Data for known concentrations of protein are used to make the standard curve, plotting concentration on the X axis, and the assay measurement on the Y axis. The same assay is then performed with samples of unknown concentration. To analyze the data, one locates the measurement on the Y-axis that corresponds to the assay measurement of the unknown substance and follows a line to intersect the standard curve. The corresponding value on the X-axis is the concentration of substance in the unknown sample.
References
- Bradford Assay Background (pdf format)
"Bradford Protein Assay" (PDF). Bio-Rad Quick Starttm Bradford Protein Assay Instructional Manual. Retrieved May 31, 2005.