Solang Valley
Solang Valley derives its name from combination of words Solang (Nearby village) and Nallah (water stream). It is a side valley at the top of the Kullu Valley in Himachal Pradesh, India 14 km northwest of the resort town Manali on the way to Rohtang Pass, and is known for its summer and winter sport conditions. The sports most commonly offered are parachuting, paragliding, skating and zorbing.
| Solang Valley | |
|---|---|
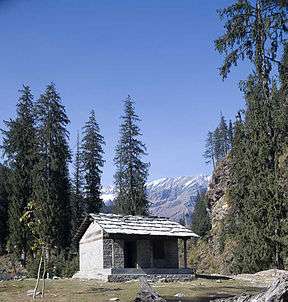
 Roadside shelter near Solang valley | |
| Floor elevation | 2,560 m (8,400 feet) |
| Geography | |
| Location | Manali, India |
| Coordinates | 32.316°N 77.157°E |
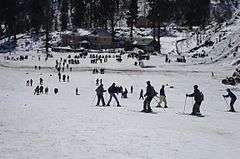
Giant slopes of lawn comprise Solang Valley and provide its reputation as a popular ski resort. A few ski agencies offering courses and equipment reside here and operate only during winters.Solag valley is well known for the tea which is sold there
Snow melts during the summer months starting May and skiing is then replaced by zorbing (a giant ball with room for 2 people which is rolled down a 200-metre hill), paragliding, parachuting and horse riding. A Ski Himalayas Ropeway was recently opened.[1] Going to the summit can be possible by ATVs, Ropeway or Climbing (Trekking)
Canadian Store is also there to purchase good quality imported products for daily use. Products range from Adventure - Camping Trekking to Lifestyle Products.
Gallery


 Solang valley Power House
.jpg) Solang valley Paragliding ground/ropeway (28-02-2019)
Solang valley Paragliding ground/ropeway (28-02-2019)
Climate

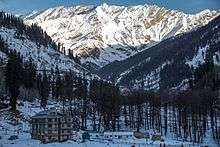
The climate in Solang Valley is very cold during winter and moderately chilly during summer. The temperatures ranges from −12 °C (10 °F) to 25 °C (77 °F) over the year with the hottest day crossing 25 °C (77 °F) and the coldest day going below −10 °C (14 °F). The average temperature during summer is between 5 °C (41 °F) to 25 °C (77 °F), and between −12 °C (10 °F) to 8 °C (46 °F) in the winter.
| Climate data for Solang valley , Record temperatures are from (2018–2019) | |||||||||||||
|---|---|---|---|---|---|---|---|---|---|---|---|---|---|
| Month | Jan | Feb | Mar | Apr | May | Jun | Jul | Aug | Sep | Oct | Nov | Dec | Year |
| Record high °C (°F) | 6.5 (43.7) |
6.0 (42.8) |
17.0 (62.6) |
21.0 (69.8) |
25.7 (78.3) |
25.8 (78.4) |
25.7 (78.3) |
24.2 (75.6) |
22.1 (71.8) |
17.3 (63.1) |
12.6 (54.7) |
8.8 (47.8) |
25.8 (78.4) |
| Average high °C (°F) | 1.8 (35.2) |
1.8 (35.2) |
8.2 (46.8) |
17.0 (62.6) |
18.0 (64.4) |
22 (72) |
21.3 (70.3) |
20.0 (68.0) |
17.5 (63.5) |
13.0 (55.4) |
7.8 (46.0) |
5.0 (41.0) |
12.8 (55.0) |
| Daily mean °C (°F) | −2.0 (28.4) |
−1.5 (29.3) |
2.7 (36.9) |
10.3 (50.5) |
11.8 (53.2) |
15.3 (59.5) |
16.3 (61.3) |
15.6 (60.1) |
13.3 (55.9) |
7.9 (46.2) |
3.7 (38.7) |
0.9 (33.6) |
7.9 (46.1) |
| Average low °C (°F) | −5.8 (21.6) |
−4.8 (23.4) |
−2.8 (27.0) |
3.7 (38.7) |
5.6 (42.1) |
8.6 (47.5) |
11.3 (52.3) |
11.3 (52.3) |
9.1 (48.4) |
2.9 (37.2) |
−0.3 (31.5) |
−3.2 (26.2) |
3.0 (37.4) |
| Record low °C (°F) | −12.8 (9.0) |
−9.0 (15.8) |
−6.6 (20.1) |
−0.8 (30.6) |
3.0 (37.4) |
5.5 (41.9) |
9.0 (48.2) |
8.2 (46.8) |
6.2 (43.2) |
0.0 (32.0) |
−4.6 (23.7) |
−10.0 (14.0) |
−12.8 (9.0) |
| Average precipitation mm (inches) | 143 (5.6) |
130 (5.1) |
191 (7.5) |
137 (5.4) |
121 (4.8) |
80 (3.1) |
266 (10.5) |
239 (9.4) |
152 (6.0) |
71 (2.8) |
31 (1.2) |
66 (2.6) |
1,627 (64) |
| Source: SASE ( Not enough data to show all time record high and low temperatures) | |||||||||||||