Rahn curve
The Rahn curve is a graph used to illustrate an economic theory, proposed in 1996 by American economist Richard W. Rahn, which indicates that there is a level of government spending that maximises economic growth. The theory is used by classical liberals to argue for a decrease in overall government spending and taxation. The inverted-U-shaped curve suggests that the optimal level of government spending is 15–25% of GDP.[1][2]
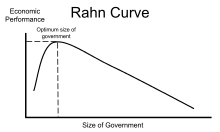
Rahn Curve
Links
References
- Richard Rahn and H. Fox: What Is the Optimal Size of Government Archived 2016-03-04 at the Wayback Machine, ime.bg, 1996.
- The Rahn Curve and the Growth-Maximizing Level of Government, video by Center for Freedom and Prosperity, freedomandprosperity.org; June 29, 2010. with subtitles, dotsub.com.
See also
External links
- Pettinger, Tejvan: The Rahn Curve – Economic Growth and Level of Spending, economicshelp.org, April 23, 2008.
- search "Rahn", freedomandprosperity.org
gollark: `grep`? (I mean, any popular simple CLI tool).
gollark: `cat`?
gollark: Or just a general random number generator thing.
gollark: Random apioform type generator?
gollark: Maybe something to generate music (WAV files)?
This article is issued from Wikipedia. The text is licensed under Creative Commons - Attribution - Sharealike. Additional terms may apply for the media files.