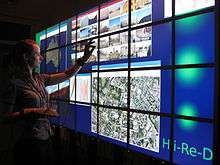
Powerwall
A powerwall is a large, ultra-high-resolution display that is constructed of a matrix of other displays, which may be either monitors or projectors. It is important to differentiate between Powerwalls and displays that are just large, for example, the single projector display used in many lecture theatres. These displays rarely have a resolution higher than 1920x1080 pixels, and so present the same amount of information as on a standard desktop display. With Powerwall displays, users can view the display from a distance and see an overview of the data (context), but can also move to within arm’s length and see data in great detail (focus). This technique of moving around the display is known as physical navigation,[1] and can help users to better understand their data.

The first Powerwall display was installed at the University of Minnesota [2] in 1994. It was made of four rear-projection displays, providing a resolution of 7.8 million pixels (3200x2400 pixels). Increases in graphic display power, combined with decreases in hardware costs, means that less hardware is required to drive such displays. In 2006, a 50–60 mega-pixel Powerwall display required a cluster of seven machines to drive it, in 2012 the same display could be driven by a single machine with three graphics cards, and in 2015 it could be driven by a single graphics card alone. Rather than seeing a decrease in the use of PC clusters as a result of this, we are instead seeing cluster-driven Powerwall displays with even higher resolutions. Currently, the highest resolution display in the world is the Reality Deck,[3] running at 1.5 billion pixels, powered by a cluster of 18 nodes.
Interaction
Both software and hardware techniques have been proposed to aid with Powerwall interaction. There have been several devices that use pointing for selection.[4] This type of interaction is well supported for collaboration, and makes it possible for multiple users to interact simultaneously. Touch interfaces also support collaboration, and increasingly multi-touch interfaces are being overlaid on top of large displays.[5] The physical size of the display, however, can leave users prone to fatigue. Mobile devices such as tablets can be used as interaction devices, but the secondary screen can distract users’ attention. It has been found that this issue can be addressed by adding physical widgets to the tablet’s screen.[6] Finally, software techniques such as modifying the window management interface or providing a lens for selecting small targets has been found to speed up interaction.[7]
Visualisation
In the field of medical visualisation, Powerwall displays have been used to render high-resolution, digitally scanned histology slides,[8][9] where the high pixel count increases the volume of data that is rendered at any one time, and the context offered by the size of the display provides a spatial reference, aiding navigation through the visualization. The same principal can also be said for geographical data such as maps, where it has been found that the large display real estate increases performance for searching and route-tracing.[10] Rather than flooding the large display real estate with data, tools such as ForceSPIRE make use of semantic interaction to enable analysts to spatially cluster data.[11]
Collaboration
Research on collaboration with Powerwall displays is related to that of tabletops, which suggests that partitioning the display space is crucial to efficient collaboration, and that distinct territories may be identified in the spatial layout of information. Physical movement, however, influences performance with large displays[1] and the relative distance among collaborators also influences their interaction.[12] Yet, most tabletop studies have participants sit down and stay put. A recent study found that during a collaborative sensemaking session in front of a multi-touch Powerwal display, the ability to physically navigate allowed users to fluidly shift between shared and personal spaces.[5]
References
- Ball, Robert; North, Chris; Bowman, Doug A. (2007). "Move to improve". Proceedings of the SIGCHI conference on Human factors in computing systems - CHI '07. pp. 191–200. doi:10.1145/1240624.1240656. ISBN 978-1-59593-593-9.
- University of Minnesota PowerWall - http://www.lcse.umn.edu/research/powerwall/powerwall.html
- Stony Brook Reality Deck - http://labs.cs.sunysb.edu/labs/vislab/reality-deck-home/
- Davis, James; Chen, Xing (2002). "Lumipoint: Multi-user laser-based interaction on large tiled displays". Displays. 23 (5): 205–11. doi:10.1016/S0141-9382(02)00039-2.
- Jakobsen, Mikkel; Hornbæk, Kasper (2012). "Proximity and physical navigation in collaborative work with a multi-touch wall-display". Proceedings of the 2012 ACM annual conference extended abstracts on Human Factors in Computing Systems Extended Abstracts - CHI EA '12. pp. 2519–24. doi:10.1145/2212776.2223829. ISBN 978-1-4503-1016-1.
- Jansen, Yvonne; Dragicevic, Pierre; Fekete, Jean-Daniel (2012). "Tangible remote controllers for wall-size displays". Proceedings of the 2012 ACM annual conference on Human Factors in Computing Systems - CHI '12. pp. 2865–74. doi:10.1145/2207676.2208691. ISBN 978-1-4503-1015-4.
- Rooney, Chris; Ruddle, Roy (2012). "Improving Window Manipulation and Content Interaction on High-Resolution, Wall-Sized Displays" (PDF). International Journal of Human-Computer Interaction. 28 (7): 423–32. doi:10.1080/10447318.2011.608626.
- Treanor, Darren; Jordan-Owers, Naomi; Hodrien, John; Wood, Jason; Quirke, Phil; Ruddle, Roy A (2009). "Virtual reality Powerwall versus conventional microscope for viewing pathology slides: An experimental comparison" (PDF). Histopathology. 55 (3): 294–300. doi:10.1111/j.1365-2559.2009.03389.x. PMID 19723144.
- The Leeds Virtual Microscope - http://www.comp.leeds.ac.uk/royr/research/rti/lvm.html
- R. Ball, M. Varghese, A. Sabri, D. Cox, C. Fierer, M. Peterson, B. Cartensen, and C. North. 2005. Evaluating the benefits of tiled displays for navigating maps. In Proceedings of the International Conference on HCI, pages 66–71. http://www.actapress.com/Abstract.aspx?paperId=22477
- Endert, Alex; Fiaux, Patrick; North, Chris (2012). "Semantic interaction for visual text analytics". Proceedings of the 2012 ACM annual conference on Human Factors in Computing Systems - CHI '12. pp. 473–82. doi:10.1145/2207676.2207741. ISBN 978-1-4503-1015-4.
- Ballendat, Till; Marquardt, Nicolai; Greenberg, Saul (2010). "Proxemic interaction". ACM International Conference on Interactive Tabletops and Surfaces - ITS '10. pp. 121–30. doi:10.1145/1936652.1936676. ISBN 978-1-4503-0399-6.