Polar diagram (sailing)
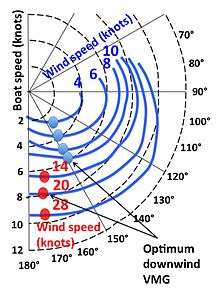
A polar diagam, or polar plot, is a graph that shows a sailing boats potential wind speed over a range of wind and sail angles.[1] It normally consists of the right side of a line chart with the x-axis representing the yacht speed and the y-axis representing the wind direction blowing from top to bottom. Several lines are normally drawn on the chart representing wind speed. To identify how fast a yacht could potentially go you select a particular wind speed curve and particular wind angle.[1] Refer to the graph to the right for an example.
Polar diagrams are normally specific to a particular sailboat design and are created by the yacht designer.[2] Polar diagrams can also be created a velocity prediction program or by a range of computer programs including iPolar and iRegatta.[2][3]
See also
External links
- ORC Sailboat Data a large database of polar diagrams maintained by the Offshore Racing Congress
References
- "What use are a yacht's polar plot for cruising?". mysailing.com.au. Retrieved 15 May 2020.
- Mills, Mark. "5 tips on developing your polar diagrams to improve your boat speed". Yachting World. Retrieved 15 May 2020.
- "IREGATTA". Zifigo. Retrieved 15 May 2020.