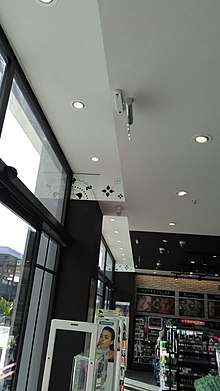
People counter
A people counter is an electronic device that is used to measure the number of people traversing a certain passage or entrance. Examples include simple manual clickers, smart-flooring technologies, infrared beams, thermal imaging systems, WiFi trackers and video counters using advanced machine learning algorithms. They are commonly used by retail establishments to judge the effectiveness of marketing campaigns, building design and layout, and the popularity of particular brands.
Industries
Retail stores
Conversion rate: People counting systems in the retail environment are used to calculate the conversion rate, which is the percentage of total visitors versus the number that make purchases.
Marketing effectiveness: Shopping mall marketing professionals rely on visitor statistics to measure the effectiveness of the current marketing campaign. Often, shopping mall owners measure marketing effectiveness with the same conversion rate as retail stores.[1]
Staff planning: Retailers can use the different business metrics in order to determine their staffing allocation. Accurate visitor counting is also useful for optimizing staff shifts. Staff requirements are often directly related to the density of visitor traffic, and services such as cleaning and maintenance are typically undertaken when traffic is at its lowest.[2]
Shopping malls
Monitoring of high-traffic areas: Shopping centers use people counters to measure the number of visitors in a given area. People counters also assist in measuring the areas where people tend to congregate. The areas where people tend to gather are often charged higher rent.[3]
Determining popularity of particular brands: Shopping malls prefer to lease space to only the most popular brands. People counters help shopping malls discover popularity by determining footfall patterns and traffic. Shopping mall owners are able to determine the flow of traffic per customer, and which areas and the levels of use of the different mall entrances.[4]
Public transportation
Occupancy throughout the route Combining with GPS positioning, people counting system inside a bus or train can help to measure the actual occupancy buses throughout their journey. This would help bus operator to allocate funding and resources to routes. [5]
Business metrics
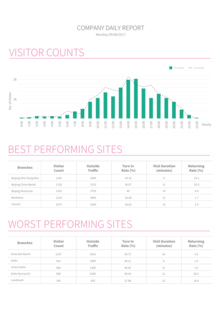
People counters are used to measure different business metrics. While there are many different types of people counters and each model varies in the metrics supported, most people counters will offer some or all of the following metrics.
Footfall
Footfall measures the number of people who enter a shop or business in a particular period of time.[6] When analysing trends, the footfall is often averaged over periods such as days or weeks.[7][8][9]
Conversion rate
The window conversion rate is the percentage of shoppers who enter a store compared to the number of people who walk by it. With WiFi counting, shops can estimate the number of people who walk past a store. However, a more accurate method is video counting. The number of people who walk past a store often reflects the potential of the store location, while the window conversion rate depends on factors such as the attractiveness of the shop window design and the effectiveness of marketing campaigns.[10]
Visit duration
Visit duration is the amount of time visitors stay in a venue. Through WiFi counting, owners can track the time a person carrying a smartphone entered and left the venue.[11]
Bubble map/heat map
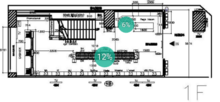
This metric tracks the user engagement per districts, sections, and courts of a compound. The bubble map or heat map allows users to analyze the number of engagement in percentage across the entire compound at a period of time. Bubble maps and heat maps function similarly, the only difference being the methodology of display. A heat map shows the engagement level through the use of colors, with warmer colors showing more engagement, whereas a bubble map shows engagement in terms of percentile and circumference of the bubble drawn.
Zone counting/traffic flow
This metric, similar to the bubble map and heat map, allows the user to see the flow of traffic in a shopping mall and to analyze the levels of engagement. With the traffic flow diagram, the mall owner is able to determine what is the most popular district of the mall, and may choose to lease their rental areas based on demand.[12]
Outside traffic
Measuring outside traffic allows retailers to determine the number of people passing by the retail store on any given day and to estimate how many potential customers a location will be able to bring to the business.[13]
Returning customers
This metric looks at the number of people entering a store who had visited the store previously by tracking the unique WiFi signal ID transmitted by a smartphone.[14]
Current technology
Many different technologies are used in people counting devices, such as smart-flooring technologies, infrared beams, thermal imaging, computer vision, and WiFi counting.[15] The current fourth generation of people counter utilize stereoscopic imaging to overcome the limitations imposed by previous generations such as shadow issues, high traffic counting, and disruption of patterns on the floor.
Video counting

Computer vision works via an embedded device, reducing the network bandwidth usage, as only the number of people must be sent over the network. Adaptive algorithms have been developed to provide accurate counting for both outdoor and indoor locations. Multi-layer background subtraction, based on color and texture, is considered the most robust algorithm[16] available for varying shadows and lighting conditions.[17] With the advances in image processing, video counting can achieve 98% accuracy in some lighting environments.[18] The use of artificial intelligence and pattern recognition functions is expected to further enhance its accuracy.[19]
WiFi counting
WiFi counting uses a WiFi receiver to pick up unique WiFi management frames emitted from smartphones within range.[20] While not all people carry a smartphone, WiFi counting can produce statistically significant metrics with a large enough sample size. Modern mobile operating systems, such as Apple's iOS9 and Android 6.0 Marshmallow, use MAC rotation schemes which makes WiFi counting more challenging without using sophisticated algorithms.[21][22]
Video verification
The 4th generation of people counters includes an option for users to review the authenticity and integrity of the data provided by their people counter. The user will be able to verify the accuracy of the counter and make business decisions accordingly, factoring in all the disparity of data.
Seamless integration with store environment
People counters are designed to integrate with the store environment in order to minimize obstruction and disruption of the store environment. Furthermore, since people counters may be easily mistaken for surveillance cameras shoppers may feel uneasy and distracted if they are not properly designed and installed. If the people counter is not properly hidden or seamlessly integrated to the environment, the purchasing behavior of consumers will be affected if they are misled to believe that they are under surveillance.[23]
Additional Features
Fourth-generation people counters build on previous technology to include:
History
Predecessors to electronic people counters
Before the advent of electronic people counters manual people counters were used. These required a store employee to stand near the entrance of the store and click on a counting device each time a person entered the store. This was considered to be inaccurate due to the high level of human error, as well as being an inefficient usage of human resource. Pressure sensitive sensors that count walk-ins based on the number of footsteps on a pressure sensitive platform or mat were used as well.
1st generation: Infrared beam counters (2002-2004)
The first UK beam counters were installed by Business Blueprints in 1988 at Meadowhall centre, outside Sheffield, Yorks. They covered all 14 entrances and recorded footfall of 20 million shoppers p.a.Daily manual checks were made to recalibrate each beam counter, leading to an error rate of +\-3%, significantly more accurate than later, video systems.
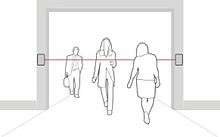
The simplest form of counter is a single, horizontal infrared beam across an entrance which is typically linked to a small LCD display unit at the side of the doorway. When the beam is broken a tick is 'recorded'. Since a person normally enters and leaves by the same door, dividing the 'ticks' by two gives a measure of visitor numbers. Beam counters usually require a receiver or a reflector mounted opposite the unit with a typical range from 2.5 metres (8 ft 2 in) to 6 metres (20 ft). Despite the limitations, infrared counters are still widely used due to their low cost and simplicity of installation.[26] The first generation of people counter had an expected accuracy level of 60% to 80%.
2nd generation: Thermal counters (2005-2011)
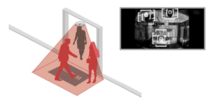
Thermal imaging systems use array sensors that detect heat sources. These systems are typically implemented using embedded technology and are mounted overhead. It is difficult to verify the accuracy of thermal counters as the image feed relay on the devices are heat sources. They can be inaccurate as thermal counters have difficulty measuring the dwell time of targets beyond a few seconds. Due to this, the second generation of people counter have an average accuracy of 80% to 85%.
3rd generation: Video and WiFi counting (2012-2016)
There are two types of 3rd-generation people counters. Video counters use complex algorithms and camera imaging to count the number of people directly from a video tape. WiFi counting functionality collects WiFi probe request signals from shoppers' smartphones, including outside the store. This adds a number of important metrics for businesses, especially for the retail industry, such as the ability to determine how effective a window marketing campaign is. With video counting technology, the expected accuracy rate of the device is 80% to 95%.
References
- Editors, Allbusiness. "Metrics for measuring ad campaign effectiveness". AllBusiness. Retrieved 17 August 2017.CS1 maint: extra text: authors list (link)
- "Using marketing insights to optimize staffing". MyCustomer. Retrieved 18 August 2017.
- Fathi, Nader. "How Shopper Analytics ensure mall thrives?". Chain Store Age. Retrieved 17 August 2017.
- D'Mello, Sandhya. "Malls in Dubai use sensors to count crowds". www.khaleejtimes.com. Retrieved 2017-08-18.
- "Automatic passenger counting systems for public transport".
- Dictionary, Oxford. "footfall". Oxford Dictionary. Retrieved 17 August 2017.
- Hounslea, Tara (6 March 2017). "Primark boosts Colchester shopping centre footfall by 30%". Drapers. Retrieved 2018-11-23.
- "Average Daily Footfall In Aviation House By Week - data.gov.uk". data.gov.uk. Retrieved 2018-11-23.
- "Marks & Spencer average footfall 2009-2018 | Statistic". Statista. Retrieved 2018-11-23.
- Dillon, Chris (30 July 2015). "Sunder Sandhe's tech game changer". Cite journal requires
|journal=(help) - "Wi-Fi Location Analytics" (PDF). Information Commissioners Office. Retrieved 18 August 2017.
- Lowry, James. "How to Use a Traffic Study to Select a Retail Site" (PDF). Women's Enterprise Centre. Retrieved 21 August 2017.
- Marsan, Jeremy. "How To Determine Foot Traffic & Use Data To Pick A Business Location". Fit Small Business. Retrieved 18 August 2017.
- Clifford, Stephanie; Hardy, Quentin. "Attention, Shoppers: Store Is Tracking Your Cell". NY Times. Retrieved 18 August 2017.
- Paul C. Box, Joseph C. Oppenlander (1976), Manual of traffic engineering studies, Institute of Transportation Engineers, p. 17, retrieved December 21, 2010
- Yao, Jian; Odobez, Jean-Marc. "Multi-Layer Background Subtraction Based on Color and Texture" (PDF). Semantics Scholar. Retrieved 21 August 2017.
- Jian Yao; Jean-Marc Odobez (2007). Multi-Layer Background Subtraction Based on Color and Texture (PDF). The CVPR Visual Surveillance Workshop (CVPR-VS). Minneapolis, MN, US: IEEE. doi:10.1109/CVPR.2007.383497.
- "How a CCTV People Counting System Works". Retail Sensing. Retrieved 15 April 2016.
- Hsu, Jeremy. "Computer Count of huge crowd now possible". IEEE Spectrum. Retrieved 18 August 2017.
- Wenz, John. "How Wi-Fi Can Count the People in a Room Without Tracking Their Phones". Popular Mechanics. Retrieved 17 August 2017.
- "Security and Privacy Changes in iOS 9". 2015.
- Amadeo, Ron. "Android 6.0 Marshmallow, thoroughly reviewed". arstechnica.com.
- popa, m.c; rothkrantz, ljm. "Analysis of Shopping Behavior based on Surveillance System" (PDF). Video and Image Processing, Philips Research: 2512–2519.
- Ruser, Heinrich; Pavlov, Vladislav. "People counter based on fusion of reflected light intensities from an infrared sensor array" (PDF). Institut für Mess- und Automatisierungstechnik (IMA).
- Sarre, Rick. "CCTV: who can watch whom under the law?". The Conversation. Retrieved 2018-01-19.
- Kajala, L.; Almik, A.; Dahl, R.; Diksaito, L.; Erkkonen, J.; Fredman, P.; Jensen, F.; Sondergaard, K; Sievaner, T. (2007). Visitor Monitoring in Nature Area - a manual based on experiences from the Nordic and Baltic Countries. Sweden: TemaNord. p. 46. Retrieved 21 August 2017.
