PLplot
PLplot is a library of subroutines that are often used to make scientific plots in compiled languages such as C, C++, D, Fortran, Ada, OCaml and Java. PLplot can also be used interactively by interpreted languages such as Octave, Python, Perl and Tcl. The current version was written primarily by Maurice J. LeBrun and Geoffrey Furnish.

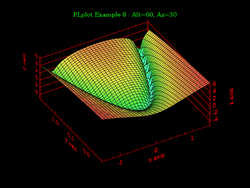
3D image made with C and PLplot
 3D surface plot rendered by PLplot | |
| Stable release | 5.14.0
/ December 12, 2018[1] |
|---|---|
| Repository | |
| Written in | C |
| Platform | Cross-platform |
| Type | Plotting |
| License | LGPL |
| Website | plplot |
License
PLplot is free software and is licensed under the LGPL.
gollark: No, it's an invisible prize - everyone wins!
gollark: ***shiny***
gollark: It would look nicer if it wasn't invisible.
gollark: This month I got a green invisiprize.
gollark: Er, hypothetical future trade.
References
External links
This article is issued from Wikipedia. The text is licensed under Creative Commons - Attribution - Sharealike. Additional terms may apply for the media files.