MacChoro
MacChoro (pronounced MacKoro) was a computer program for choropleth mapping developed for early versions of the Apple Macintosh computer. A choropleth map shades areas, such as states or counties, to represent values and is mainly used for the mapping of statistical data. Released in 1986, MacChoro was the first computer mapping program to implement Macintosh's point-and-click user interface for the analysis and production of thematic maps. MacChoro II, released in 1988, was the first program to incorporate interaction in animated mapping.
Development
MacChoro began to be developed in the Fall of 1985 on an Apple Macintosh 512K (Fat Mac) computer with a single 400K floppy drive. The programming language was Fortran, and the code was based on a choropleth mapping program that was developed on a Digital Equipment VAX computer. It had to be re-written to incorporate the mouse, pull-down menus, and dialogs.
Data Classification
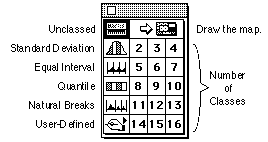
The program stressed data classification, and implemented six methods including unclassed, equal interval, quantile, natural breaks, standard deviation and user-defined. The unclassed method was limited to 16 shadings. Each of the remaining methods could be made with between 2 and 16 categories. Maps could be re-classified and displayed in a matter of seconds. The program was especially useful for comparing different methods of data classification.
Animation
An interactive animation feature was added in 1988. A second version of the program, MacChoro II, placed a series of maps into memory showing different methods of data classification, different number of classes, or different variables. Once finished, the animated series of maps could be displayed at up to 60 frames per second. A dialog controlled the speed of display and provided access to the individual frames.
References
- Peterson, Michael P. (1995) Interactive and Animated Cartography. Englewood Cliffs, NJ: Prentice-Hall.
- Peterson, Michael P. (1994) Spatial Visualization through Cartographic Animation: Theory and Practice. Proceedings of Geographic Information Systems / Land Information Systems GIS/LIS 1994, pp. 250-258.
- Peterson, Michael P. (1993) Interactive Cartographic Animation. Cartography and Geographic Information Systems, 1993, Vol. 20, No. 1, 1993, pp. 40-44.
- Tobler, W. (1973) "Choropleth Maps Without Class Intervals?." Geographical Analysis 3: 262-265.
External links
[[Category:Aide Category:Data visualization software]]