List of South American countries by GDP (PPP) per capita
This is a list of South American nations by gross domestic product per capita based on purchasing power parity.
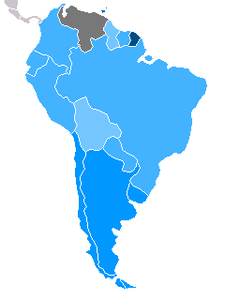
South American countries by GDP PPP per capita according to the International Monetary Fund for 2018
|
>$60,000
$40,000 - $50,000
$30,000 - $40,000
$20,000 - $30,000
$10,000 - $20,000
$5,000 - $10,000
$2,000 - $5,000
<$2,000 |
IMF list
List according to the International Monetary Fund in current international dollars for 2018.[1]
| Rank | Country/Territory | GDP (PPP) per capita (Int$) | Year |
|---|---|---|---|
| 1 | 25,978 | 2018 est. | |
| 2 | 23,274 | 2018 est. | |
| 3 | 20,537 | 2018 est. | |
| 4 | 16,154 | 2018 est. | |
| 5 | 15,105 | 2018 est. | |
| 6 | 14,943 | 2018 est. | |
| 7 | 14,224 | 2018 est. | |
| 8 | 13,395 | 2018 est. | |
| 9 | 11,718 | 2018 est. | |
| 10 | 8,519 | 2018 est. | |
| 11 | 7,477 | 2018 est. | |
| — | n/a | 2018 est. |
World Bank list
All figures are in 2017 international dollars according to the World Bank, and rounded to the nearest whole number.[2]
| Rank | Country | GDP (PPP) per capita (2017 Int$) | Year |
|---|---|---|---|
| 1 | 24,226 | 2019 est. | |
| 2 | 22,034 | 2019 est. | |
| 3 | 21,561 | 2019 est. | |
| 4 | 16,329 | 2019 est. | |
| 5 | 14,731 | 2019 est. | |
| 6 | 14,652 | 2019 est. | |
| 7 | 12,848 | 2019 est. | |
| 8 | 12,685 | 2019 est. | |
| 9 | 11,375 | 2019 est. | |
| 10 | 9,703 | 2019 est. | |
| 11 | 8,725 | 2019 est. | |
| — | n/a | 2019 est. |
CIA list
All figures are in current international dollars according to The World Factbook by the Central Intelligence Agency, rounded to the nearest hundred.[3]
| South American Rank | World Rank | Nation | GDP (PPP) per capita (Int$) | Year |
|---|---|---|---|---|
| 1 | 59 | 24,600 | 2017 est. | |
| 2 | 63 | 22,400 | 2017 est. | |
| 3 | 66 | 20,700 | 2017 est. | |
| 4 | 84 | 15,500 | 2017 est. | |
| 5 | 89 | 14,500 | 2017 est. | |
| 6 | 90 | 13,900 | 2017 est. | |
| 7 | 93 | 13,300 | 2017 est. | |
| 8 | 100 | 12,400 | 2017 est. | |
| 9 | 109 | 11,200 | 2017 est. | |
| 10 | 113 | 9,800 | 2017 est. | |
| 11 | 121 | 8,300 | 2017 est. | |
| 12 | 125 | 7,500 | 2017 est. |
gollark: Also, did you try comparing a turtle quarry to a digital miner or something?
gollark: What did you want them for?
gollark: Well, you should explain that while it can, technically, do a lot of things, it takes a lot of work to do that and it can be overshadowed pretty easily by dedicated tools/blocks/whatever.
gollark: Oh. Right. Yes. That.
gollark: It can? I thought it was only up to 9x9 or something.
References
- "World Economic Outlook Database, April 2019". IMF.org. International Monetary Fund. Retrieved 30 August 2019.
- "GDP per capita, PPP (constant 2017 international $) - Chile, Argentina, Uruguay, Paraguay, Bolivia, Peru, Brazil, Ecuador, Colombia, Suriname, Venezuela, RB". The World Bank - Data.
- "COUNTRY COMPARISON :: GDP - PER CAPITA (PPP)". Central Intelligence Agency. Central Intelligence Agency. Retrieved 10 April 2018.
This article is issued from Wikipedia. The text is licensed under Creative Commons - Attribution - Sharealike. Additional terms may apply for the media files.