Java Platform Debugger Architecture
The Java Platform Debugger Architecture (JPDA) is a collection of APIs to debug Java code.
- Java Debugger Interface (JDI) - defines a high-level Java language interface that developers can easily use to write remote debugger application tools.
- Java Virtual Machine Tools Interface (JVMTI), a native interface that helps to inspect the state and to control the execution of applications running in the Java Virtual Machine (JVM).
- Java Virtual Machine Debug Interface (JVMDI)- JVMDI was deprecated in J2SE 5.0 in favor of JVM TI, and was removed in Java SE 6.
- Java Debug Wire Protocol (JDWP) - defines communication between debuggee (a Java application) and debugger processes.
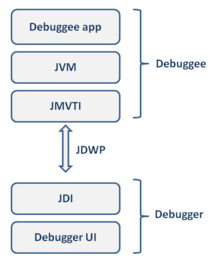
JPDA architecture
Java Debugger Interface (JDI)
JDI is the highest-layer of the Java Platform Debugger Architecture. It allows to access the JVM and the internal variables of the debugged program. It also allows to set Breakpoints, stepping, and handle threads.[1]
See also
- Eclipse, an open-source IDE integrated with JPDA support
- IntelliJ IDEA, a commercial open-source Java IDE with integrated JPDA support
- JSwat, an open-source Java debugger using the JPDA
- NetBeans, an open-source IDE using the JPDA
References
- "An Intro to the Java Debug Interface (JDI)". baeldung.com. 2019-09-07. Retrieved 2020-01-19.
External links
This article is issued from Wikipedia. The text is licensed under Creative Commons - Attribution - Sharealike. Additional terms may apply for the media files.