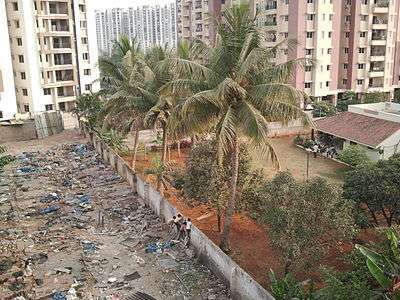
Income inequality in India
Income inequality in India refers to the unequal distribution of wealth and income among its citizens. According to the CIA World Factbook, the Gini index of India, which is a measure of income distribution inequality, was 35.2 in 2011, ranking 95th out of 157.[1] Wealth distribution is also uneven, with one report estimating that 54 percent of the country's wealth is controlled by millionaires, the second highest after Russia as of November 2016.[2] The richest 1% of Indians own 58.4% of wealth. The richest 10 % of Indians own 80.7 % of the wealth. This trend is going in the upward direction every year, which means the rich are getting richer at a much faster rate than the poor.[2] Inequality worsened since the establishment of income tax in 1922, overtaking the British Raj's record of the share of the top 1% in national income, which was 20.7% in 1939–40.[3]

Income gaps
According to Thomas Piketty, there is a "huge" gap in data about income tax in India.[4][5] Since the most of the population is out of income-tax database, most of the calculations (such as NSSO) is based on consumption-expenditure data instead of income data.[6] According to the World Bank, the Gini coefficient in India was 0.339 in 2009.[7] The Gini coefficient in India went up from 0.43 (1995–96) to 0.45 (2004–05).[8] According to the 2015 World Wealth Report, India had 198,000 high net worth individuals (annual income over $1 million) with a combined wealth of $785 billion.[9] In 2016, the International Monetary Fund in its regional economic outlook for Asia and Pacific said that India’s Gini coefficient rose to 0.51 in 2013 from 0.45 in 1990.[10]
Class divide
Credit Suisse’s Global Wealth Databook for 2014 reports bottom 10 per cent of the Indian society owned merely 0.2 per cent of national wealth[11] while the richest 10 per cent have been getting steadily richer since 2000.
| Social Class (%) | Wealth Share (%) |
|---|---|
| Bottom 10 | 0.2 |
| 10 - 20 | 0.4 |
| 20 - 30 | 0.8 |
| 30 - 40 | 0.3 |
| 40 - 50 | 0.8 |
| 50 - 60 | 2.6 |
| 60 - 70 | 3.8 |
| 70 - 80 | 5.7 |
| 80 - 90 | 19.4 |
| Top 10 | 77 |
Causes
N. C. Saxena, a member of the National Advisory Council, suggested that the widening income disparity can be accounted for by India's badly shaped agricultural and rural safety nets. "Unfortunately, agriculture is in a state of collapse. Per capita food production is going down. Rural infrastructure such as power, road transport facilities are in a poor state," he said. "All the safety net programmes are not working at all, with rural job scheme and public distribution system performing far below their potential. This has added to the suffering of rural India while market forces are acting in favour of urban India, which is why it is progressing at a faster rate."[12]
Impact
India's economy continues to grow with its GDP rising faster than most nations. But a rise in national GDP is not indicative of income equality in the country. The growing income inequality in India has negatively impacted poor citizens' access to education and healthcare. Rising income inequality makes it difficult for the poor to climb up the economic ladder and increases their risk of being victims to poverty trap.[13] People living at the bottom 10% are characterized by low wages; long working hours; lack of basic services such as first aid, drinking water and sanitation.[8]
References
- "Country Comparison - Distribution of Family Income - Gini Index". cia.gov. Central Intelligence Agency. Retrieved 3 February 2020.
- "India second most 'unequal' country after Russia: Report". dailypioneer.com. 4 September 2016. Retrieved 1 March 2019.
- From British Raj to Billionaire Raj, Economic and Political Weekly, 7 October 2017
- Rowlatt, Justin (2 May 2016). "'Indian inequality still hidden'". BBC.
- http://aida.wss.yale.edu/~nq3/NANCYS_Yale_Website/resources/papers/PikettyQianAEJ.pdf
- https://www.wider.unu.edu/sites/default/files/wp2015-025.pdf
- "GINI index (World Bank estimate) - Data". data.worldbank.org.
- "India still suffers from huge income gap". southasia.oneworld.net.
- "World Wealth Report - Compare the data on a global scale". The Wealth Reports. Leading with Global Insights. The Industry Recognized Benchmark for Wealth Management Trends. www.worldwealthreport.com.
- Nair, Remya (3 May 2016). "IMF warns of growing inequality in India and China". Livemint.
- S, Rukmini (8 December 2014). "India's staggering wealth gap in five charts". The Hindu.
- "Income gap rises in India: NSSO". Livemint.
- "Does income inequality hurt economic growth? — Quartz". qz.com. Retrieved 2018-09-26.
- http://thewire.in/39495/as-nda-govt-celebrates-two-years-a-citizens-report-underscores-its-failures-on-social-issues/ Citizens' Report Underscores Modi Government Failures on Social Issues
- "'Reckless disinvestment in PSUs has exposed BJP's capitalistic mindset'". The Hindu. 23 October 2016.