Hyde (UK Parliament constituency)
Hyde was a county constituency represented in the House of Commons of the Parliament of the United Kingdom from 1885 until 1918. It was seated in the town of Hyde, Cheshire.
| Hyde | |
|---|---|
| Former County constituency for the House of Commons | |
| County | Cheshire |
| Major settlements | Hyde |
| 1885–1918 | |
| Number of members | One |
| Replaced by | Stalybridge & Hyde |
| Created from | Mid Cheshire |
From the 1918 general election onwards, the town has been represented in parliament through the constituency of Stalybridge and Hyde.
Boundaries
The constituency, officially Cheshire, Hyde Division, was created by the Redistribution of Seats Act 1885 and consisted of the following parishes and townships in north east Cheshire:[1] Bredbury, the part of Brinnington outside the Municipal Borough of Stockport, Godley , Hattersley, Hollingworth, Hyde, Marple, Mottram, Newton, Offerton, Romiley, Tintwistle, Torkington and Werneth.
Abolition
The Representation of the People Act 1918 reorganised constituencies throughout Great Britain. The bulk of the Hyde constituency was merged with parliamentary borough of Stalybridge to form the new seat of Stalybridge and Hyde. The Bredbury, Marple and Romiley areas passed to the Macclesfield constituency, while Offerton and Torkington were included in Knutsford.[1]
Members of Parliament
| Election | Member | Party | |
|---|---|---|---|
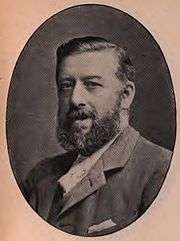
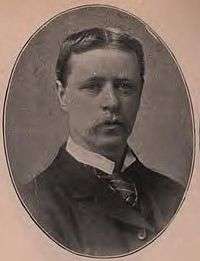
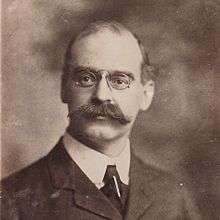
| 1885 | Thomas Ashton | Liberal | |
| 1886 | Joseph Watson Sidebotham | Conservative | |
| 1900 | Edward Chapman | Conservative | |
| 1906 | Duncan Schwann | Liberal | |
| 1910 | Francis Neilson | Liberal | |
| 1916 by-election | Thomas Owen Jacobsen | Liberal | |
| 1918 | Constituency abolished. See Stalybridge and Hyde | ||
Elections
Elections in the 1880s

| Party | Candidate | Votes | % | ± | |
|---|---|---|---|---|---|
| Liberal | Thomas Ashton | 4,546 | 53.3 | N/A | |
| Conservative | William Legh | 3,990 | 46.7 | N/A | |
| Majority | 556 | 6.6 | N/A | ||
| Turnout | 8,536 | 91.5 | N/A | ||
| Registered electors | 9,328 | ||||
| Liberal win (new seat) | |||||

| Party | Candidate | Votes | % | ± | |
|---|---|---|---|---|---|
| Conservative | Joseph Watson Sidebotham | 4,328 | 52.7 | +6.0 | |
| Liberal | Thomas Ashton | 3,885 | 47.3 | -6.0 | |
| Majority | 443 | 5.4 | N/A | ||
| Turnout | 8,213 | 88.0 | -3.5 | ||
| Registered electors | 9,328 | ||||
| Conservative gain from Liberal | Swing | +6.0 | |||
Elections in the 1890s
| Party | Candidate | Votes | % | ± | |
|---|---|---|---|---|---|
| Conservative | Joseph Watson Sidebotham | 4,525 | 51.7 | -1.0 | |
| Liberal | Thomas Ashton | 4,220 | 48.3 | +1.0 | |
| Majority | 305 | 3.4 | -2.0 | ||
| Turnout | 8,745 | 90.8 | +2.8 | ||
| Registered electors | 9,629 | ||||
| Conservative hold | Swing | -1.0 | |||
| Party | Candidate | Votes | % | ± | |
|---|---|---|---|---|---|
| Conservative | Joseph Watson Sidebotham | 4,735 | 52.4 | +0.7 | |
| Liberal | George Wood Rhodes | 3,844 | 42.6 | -5.7 | |
| Ind. Labour Party | George Smith Christie | 448 | 5.0 | N/A | |
| Majority | 891 | 9.8 | +6.4 | ||
| Turnout | 9,027 | 88.4 | −2.4 | ||
| Registered electors | 10,208 | ||||
| Conservative hold | Swing | +3.2 | |||
Elections in the 1900s

| Party | Candidate | Votes | % | ± | |
|---|---|---|---|---|---|
| Conservative | Edward Chapman | 4,774 | 53.2 | +0.8 | |
| Liberal | John Brunner | 4,195 | 46.8 | +4.2 | |
| Majority | 579 | 6.4 | -3.4 | ||
| Turnout | 8,969 | 88.5 | +0.1 | ||
| Registered electors | 10,485 | ||||
| Conservative hold | Swing | -1.7 | |||
| Party | Candidate | Votes | % | ± | |
|---|---|---|---|---|---|
| Liberal | Duncan Swann | 5,545 | 55.3 | +8.5 | |
| Conservative | Edward Chapman | 4,482 | 44.7 | -8.5 | |
| Majority | 1,063 | 10.6 | N/A | ||
| Turnout | 10,027 | 88.6 | +3.1 | ||
| Registered electors | 11,314 | ||||
| Liberal gain from Conservative | Swing | +8.5 | |||
Elections in the 1910s
| Party | Candidate | Votes | % | ± | |
|---|---|---|---|---|---|
| Liberal | Francis Neilson | 4,476 | 39.5 | -15.8 | |
| Conservative | Tom Eastham | 4,461 | 39.3 | -7.5 | |
| Labour | William Crawford Anderson | 2,401 | 21.2 | n/a | |
| Majority | 15 | 0.2 | -10.4 | ||
| Turnout | 93.2 | +4.6 | |||
| Liberal hold | Swing | -4.1 | |||
| Party | Candidate | Votes | % | ± | |
|---|---|---|---|---|---|
| Liberal | Francis Neilson | 5,562 | 51.4 | +11.9 | |
| Conservative | Tom Smith | 5,268 | 48.6 | +9.3 | |
| Majority | 294 | 2.8 | +2.6 | ||
| Turnout | 89.0 | -4.2 | |||
| Liberal hold | Swing | +1.3 | |||
General Election 1914/15:
Another General Election was required to take place before the end of 1915. The political parties had been making preparations for an election to take place and by the July 1914, the following candidates had been selected;
- Liberal: Francis Neilson
- Unionist: James Leadbitter Knott
| Party | Candidate | Votes | % | ± | |
|---|---|---|---|---|---|
| Liberal | Thomas Owen Jacobsen | 4,089 | 56.0 | +4.6 | |
| Independent |
|
3,215 | 44.0 | n/a | |
| Majority | 874 | 12.0 | +9.2 | ||
| Turnout | 54.7 | -34.3 | |||
| Liberal hold | Swing | n/a | |||
- nominee of the National Union of Attested Married Men, an organisation opposed to the government's policy on conscription.
References
- F A Youngs Jr., Guide to the Local Administrative Units of England, Vol.II: Northern England, London, 1991
- British Parliamentary Election Results 1885-1918, FWS Craig
- Debrett's House of Commons & Judicial Bench, 1901