Global Historical Climatology Network
The Global Historical Climatology Network (GHCN) is a database of temperature, precipitation and pressure records managed by the National Climatic Data Center, Arizona State University and the Carbon Dioxide Information Analysis Center.[1]
The aggregate data are collected from many continuously reporting fixed stations at the Earth's surface and represent the input of approximately 6000 temperature stations, 7500 precipitation stations and 2000 pressure stations.
This work has often been used as a foundation for reconstructing past global temperatures, and was used in previous versions of two of the best-known reconstructions, that prepared by the National Climatic Data Center (NCDC), and that prepared by NASA as its Goddard Institute for Space Studies (GISS) temperature set.[2] The average temperature record is 60 years long with ~1650 records greater than 100 years and ~220 greater than 150 years (based on GHCN v2 in 2006). The earliest data included in the database were collected in 1697.
Map and description

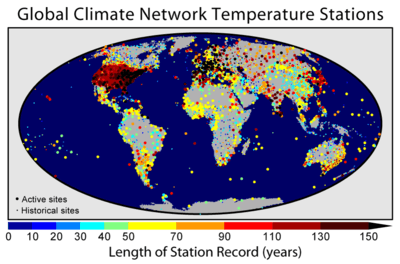
The GHCN is one of the primary reference compilations of temperature data used for climatology, and is the foundation of the GISTEMP Temperature Record. This map shows the 7,280 fixed temperature stations in the GHCN catalog color-coded by the length of the available record. Sites that are actively updated in the database (2,277) are marked as "active" and shown in large symbols, other sites are marked as "historical" and shown in small symbols. In some cases, the "historical" sites are still collecting data but due to reporting and data processing delays (of more than a decade in some cases) they do not contribute to current temperature estimates.
As is evident from this plot, the most densely instrumented portion of the globe is in the United States, while Antarctica is the most sparsely instrumented land area. Parts of the Pacific and other oceans are more isolated from fixed temperature stations, but this is supplemented by volunteer observing ships that record temperature information during their normal travels. This image shows 3,832 records longer than 50 years, 1,656 records longer than 100 years, and 226 records longer than 150 years. The longest record in the collection began in Berlin in 1701 and is still collected in the present day.
References
- Peterson, Thomas C. and Russell S. Vose (1997). "An overview of the Global Historical Climatology Network temperature data base". Bulletin of the American Meteorological Society. 78 (12): 2837–2849. Bibcode:1997BAMS...78.2837P. CiteSeerX 10.1.1.170.6141. doi:10.1175/1520-0477(1997)078<2837:AOOTGH>2.0.CO;2. ISSN 1520-0477.
- GISS Surface Temperature Analysis (GISTEMP), National Aeronautics and Space Administration (NASA)/Goddard Institute for Space Studies (GISS), nd, retrieved May 9, 2014
Further reading
- Peterson, Thomas C. and Russell S. Vose (1997). "An overview of the Global Historical Climatology Network temperature data base". Bulletin of the American Meteorological Society. 78 (12): 2837–2849. Bibcode:1997BAMS...78.2837P. CiteSeerX 10.1.1.170.6141. doi:10.1175/1520-0477(1997)078<2837:AOOTGH>2.0.CO;2. ISSN 1520-0477.