GIS and hydrology
Geographic information systems (GISs) have become a useful and important tool in the field of hydrology to study and manage Earth's water resources. Climate change and greater demands on water resources require a more knowledgeable disposition of arguably one of our most vital resources. Because water in its occurrence varies spatially and temporally throughout the hydrologic cycle, its study using GIS is especially practical. Whereas previous GIS systems were mostly static in their geospatial representation of hydrologic features, GIS platforms are becoming increasingly dynamic, narrowing the gap between historical data and current hydrologic reality.
The elementary water cycle has inputs equal to outputs plus or minus change in storage. Hydrologists make use of this hydrologic budget when they study a watershed. The inputs in a hydrologic budget include precipitation, surface flow, and groundwater flow. Outputs consist of evapotranspiration, infiltration, surface runoff, and surface/groundwater flows. All of these quantities can be measured or estimated based on environmental data and their characteristics can be graphically displayed and studies using GIS.
GIS in surface water

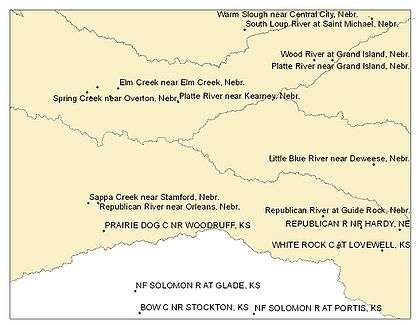
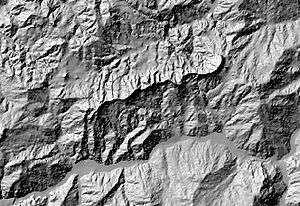
In the field of hydrological modeling, analysis generally begins with the sampling and measurement of existing hydrologic areas. In this stage of research, the scale and accuracy of measurements are key issues[1]. Data may either be collected in the field or through online research. The United States Geological Survey ((USGS)) is a publicly available source of remotely sensed hydrological data. Historical and real-time streamflow data are also available via the internet from sources such as the National Weather Service (NWS) and the United States Environmental Protection Agency (EPA). A benefit of using GIS softwares for hydrological modeling is that digital visualizations of data can be linked to real-time data. GIS revolutionized curation, manipulation, and input for complex computational hydrologic models [2][3] For surface water modeling, digital elevation model are often layered with hydrographic data in order to determine the boundaries of a watershed[4] . Understanding these boundaries is integral to understanding where precipitation runoff will flow. For example, in the event of snowmelt, the amount of snowfall can be input into GIS to predict the amount of water that will travel downstream [5]. This information has applications in local government asset management, agriculture and environmental science. Another useful application for GIS regards flood risk assessment. Using digital elevation models combined with peak discharge data can predict which areas of a floodplain will be submerged depending on the amount of rainfall. In a study of the Illinois River watershed, Rabie (2014)[6] found that a decently accurate flood risk map could be generated using only DEMs and stream gauge data. Analysis based on these two parameters alone does not account for manmade developments including levees or drainage systems, and therefore should not be considered a comprehensive result.

GIS in groundwater
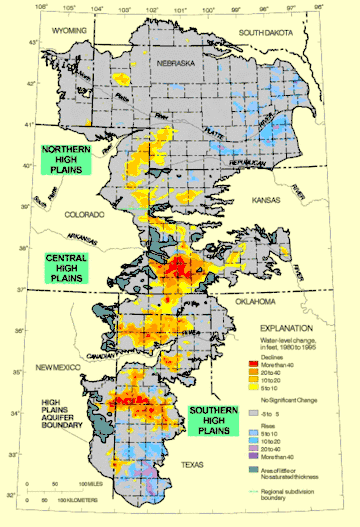
The use of GIS to analyze groundwater falls into the field of hydrogeology. Since 98% of available freshwater on Earth is groundwater[7], the need to effectively model and manage these resources is apparent. As the demand for groundwater continues to increase with the world’s growing population, it is vital that these resources be properly managed. Indeed, when groundwater usage is not monitored sufficiently, it may result in damage to aquifers or groundwater-related subsidence, as occurred in the Ogallala aquifer in the United States. In some cases, GIS can be used to analyze drainage and groundwater data in order to select suitable sites for groundwater recharge[8].

References
- Clark, Michael (May 1998). "Putting water in its place: a perspective on GIS in hydrology and water management". Hydrological Processes. 12 (6). doi:10.1002/(SICI)1099-1085(199805)12:6<823::AID-HYP656>3.0.CO;2-Z.
- Garbrecht, Jurgen; Ogden, Fred L.; DeBarry, Paul A.; Maidment, David R. (2001). "GIS and distributed watershed models. I: Data coverages and sources". Journal of Hydrologic Engineering. 6 (6): 506-514.
- Ogden, Fred L.; Garbrecht, Jurgen; DeBarry, Paul A.; Johnson, Lynn E. (2001). "GIS and distributed watershed models. II: Modules, Interfaces and Models". Journal of Hydrologic Engineering. 6 (6): 515-523.
- Naidu, Dadi (December 2015). "Use of GIS in Hydrological Investigations" (PDF). International Journal of Interdisciplinary Advanced Research Trends. II (2).
- Naidu, Dadi (December 2015). "Use of GIS in Hydrological Investigations" (PDF). International Journal of Interdisciplinary Advanced Research Trends. II (2).
- Rabie, Anas (2014). "Integrating GIS and hydrology for flood risk analysis". Cite journal requires
|journal=(help) - Naidu, Dadi (December 2015). "Use of GIS in Hydrological Investigations". International Journal of Multidisciplinary Advanced Research Trends. 2 (2).
- Saraf, A. K.; Choudhury, P. R. (25 Nov 2010). "Integrated remote sensing and GIS for groundwater exploration and identification of artificial recharge sites". International Journal of Remote Sensing. 19 (10). doi:10.1080/014311698215018.
- Girish Kumar, M., Bali, R. and Agarwal, A.K (2009). GIS Integration of remote sensing and electrical data for hydrological exploration- A case study of Bhakar watershed, India. Hydrological Sciences Journal 54 (5) pp 949–960.
- Dingman, S. Lawrence, Physical Hydrology, Prentice-Hall, 2nd Edition, 2002
- Fetter, C.W. Applied Hydrogeology, Prentice-Hall, 4th Edition, 2001
- Maidment, David R., ed. Arc Hydro: GIS for Water Resources, ESRI Press, 2002
See also
External links
- Spatial Hydrology
- GIS Lounge
- ArcNews Online
- US Army Geospatial Center — For information on OCONUS surface water and groundwater.